


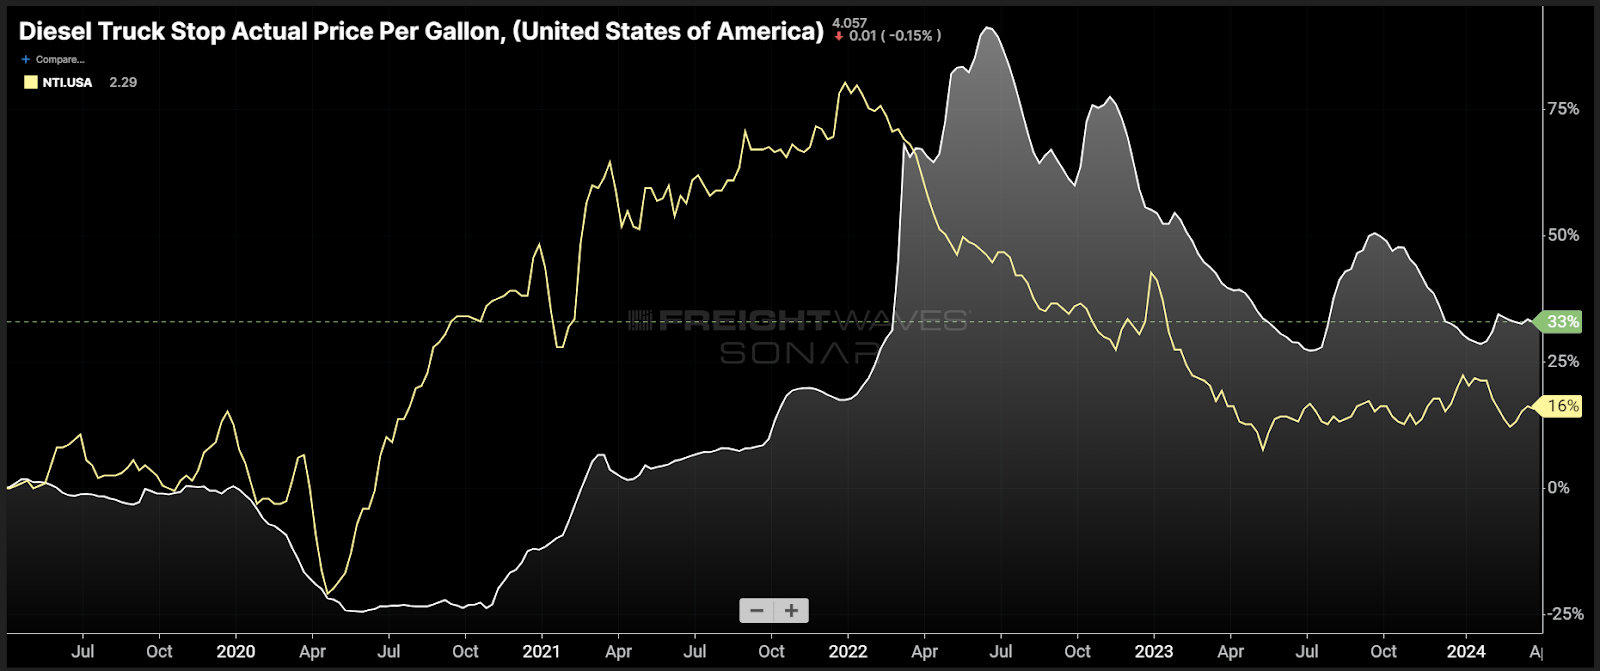
Chart of the Week: Diesel Truck Stop Actual Price Per Gallon, National Truckload Index – USA SONAR: DTS.USA, NTI.USA
Retail diesel fuel costs (DTS) are up 33% versus April 2019, while the National Truckload Index (NTI) that measures all-in spot rates are only up 16% over the same time. The implication is that carriers are in a far worse position on the spot market than they were in 2019 as they are unable to fully pass along operating costs.
Fuel is just one of many trucking operating cost inputs that have inflated dramatically over the past five years, but it is one of the largest measurable costs that are relatively homogenous across the national carrier base. It is also a glaring example of how desperate the truckload spot market has become.
Doing the math to calculate the average cost per mile based on 6.5 mpg, an industry standard that many fuel surcharges are based on, we get the outputs in the chart below:
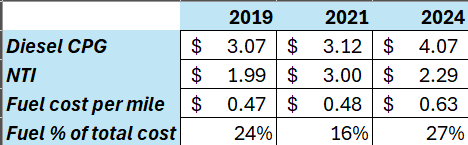
The average diesel cost per gallon and NTI values were taken from early April of each year. The cost-per-mile estimates from 2019 to 2024 may not seem that dramatic to the casual observer, but putting it in the context of what it was during a more profitable year, the swings are significant.
The full context is that 2019 and 2024 are arguably two of the softest truckload capacity environments in history; carriers had little to no pricing power. The 2021 market was nearly the exact opposite.
The fact that carriers seem to have less pricing power than in 2019 should not be taken lightly. It shows there is a level of desperation not reflected in the nominal rate, which is up 16%.
Fuel costs tend to rank second behind driver wages in terms of a carrier’s total costs. According to a 2023 ATRI report, driver wages increased 30% from 2019 to 2022. Maintenance costs were right there as well, with a 30% increase.
Point being the 16% rate increase is actually a decrease when incorporating inflated operating expenses. Adding them all together means that carriers are almost certainly losing money consistently on the spot market.
Why it matters
Unprofitability is unsustainable in a free market. That statement is not news, but the severity of the unsustainability is what should be most alarming. This environment is significantly worse than 2019 for transportation service providers.
Anyone procuring or managing transportation where long-term or contract rates are at or near spot market levels is at a severe risk of service failure if the market flips, which it will inevitably do.
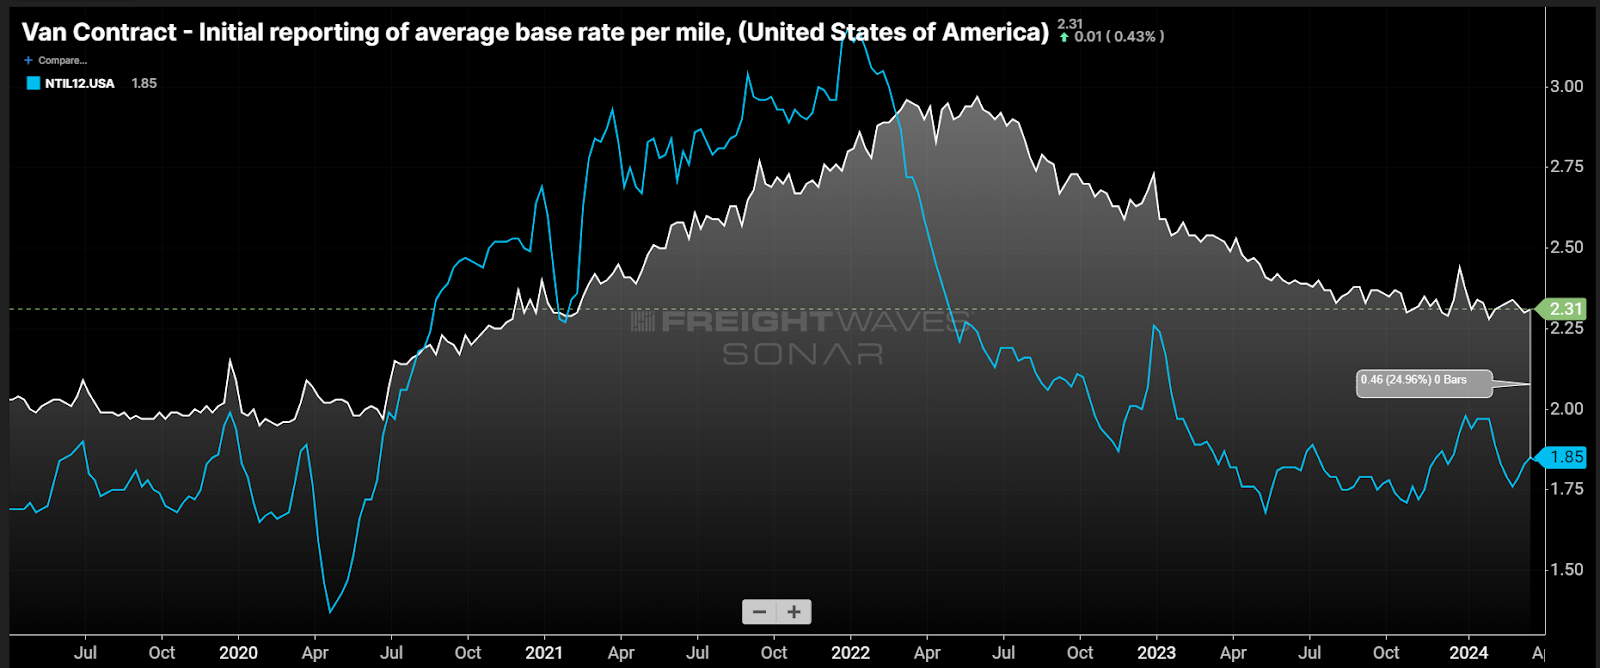
Contract base rates (VCRPM1) from SONAR’s invoice database show that contracts are roughly 25% higher than the spot market rates excluding fuel costs above $1.20 per gallon — comparable to a standard fuel surcharge — on average. The invoice data skews heavily toward the larger carrier and larger shipper contract agreement, which represents the bulk of the domestic truckload environment in the U.S.
Shippers who find their rates in line with spot rates appear to be in a good place for the near term as they enjoy significant cost savings. But it is like playing the stock market: You need to get out of that position before the market flips, or you are at risk for heavy losses in the form of service failures.
Neither shipper nor carrier/broker is to blame for the freight market volatility. It is a byproduct of a free market. Most of the participants on either side will chase dollars in a short-term play. This can be fruitful if timed well and you are actively monitoring the data at a detailed level. Participants who want a more hands-off approach need to employ a different strategy.
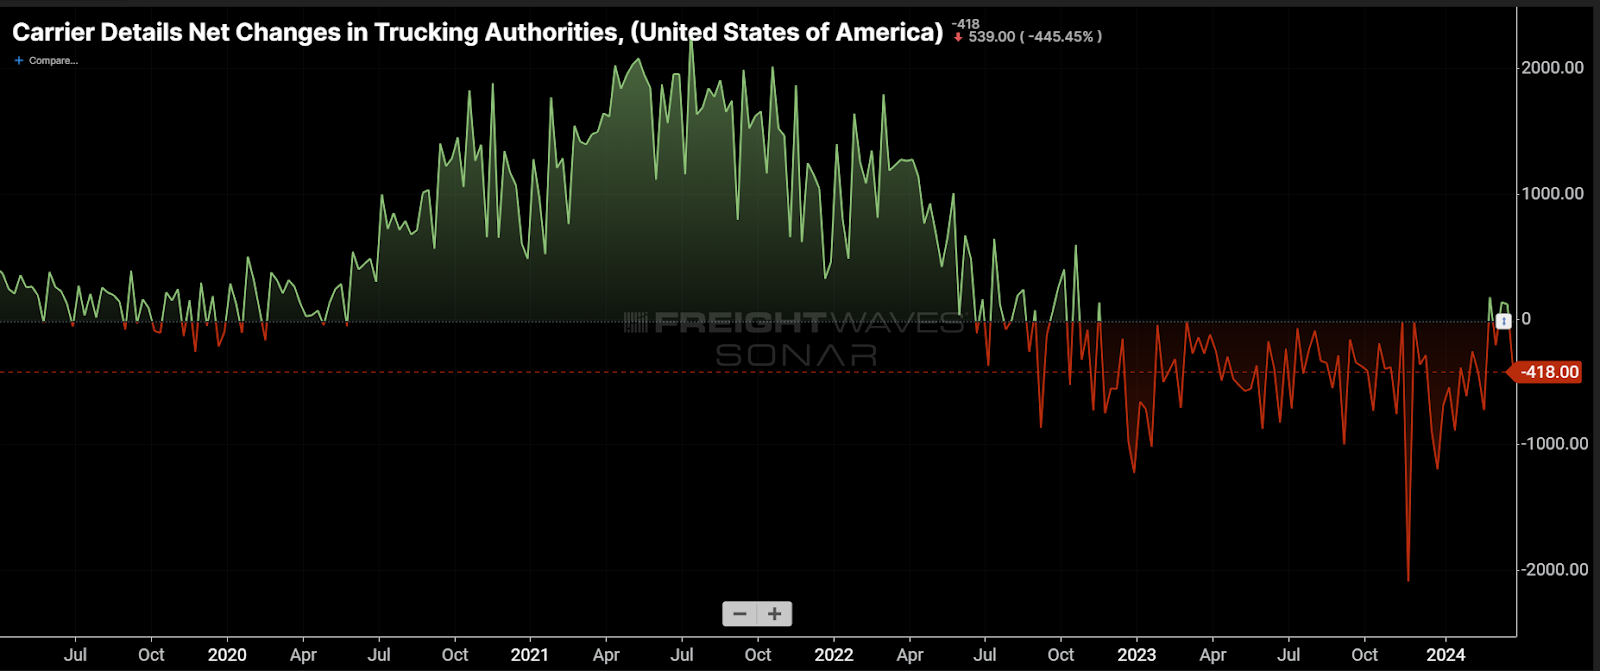
Active trucking operating authorities continue to deteriorate, another sign that the market is moving closer to equilibrium. This mechanism is very slow to manifest itself clearly and can appear with little warning.
There are no immediate signals that the market is turning at the moment. But history has shown us that it can happen nearly overnight.
Credit to SONAR Account Executive Kyle Taylor for helping identify this week’s chart.
About the Chart of the Week
The FreightWaves Chart of the Week is a chart selection from SONAR that provides an interesting data point to describe the state of the freight markets. A chart is chosen from thousands of potential charts on SONAR to help participants visualize the freight market in real time. Each week a Market Expert will post a chart, along with commentary, live on the front page. After that, the Chart of the Week will be archived on FreightWaves.com for future reference.
SONAR aggregates data from hundreds of sources, presenting the data in charts and maps and providing commentary on what freight market experts want to know about the industry in real time.
The FreightWaves data science and product teams are releasing new datasets each week and enhancing the client experience.
To request a SONAR demo, click here.

Amjad Jamal
Cost of diesel is the biggest factor, others costs are parts and repair also hurting the small fleets and owners operators. Brokers are not following the rules or any laws. Never mentioned the original price. If any carrier asks about that, will be not entertained.
Tim Reis
The author is completely wrong in his assessment when he writes ‘Neither shipper nor carrier/broker is to blame for the freight market volatility. It is a byproduct of a free market.’ The article ignores the root cause which is the FED and interest rates. High interest rates killed the market. High interest rates killed the housing market to name just one sector which in turn significantly reduced the tonnage available to put into a truck.
Steve Webster
In Canada fuel costs are over 50% of the spot rates for reefer and dry van rates and bulk haul and flatbed. Contract rates are a little better over 20 trucking finance companies having difficulty in Canada
The carbon tax should not apply to food production or reefer fuel in my opinion