
Bitcoin (BTC) is currently maintaining its position above $70,000 as the market anticipates how the maiden cryptocurrency’s price will evolve ahead of the upcoming halving event.
With the event often associated with bullish sentiment, Bitcoin will need to surpass its previous record high of over $73,000 to reach new heights.
In this case, a crypto analyst by the pseudonym El_crypto_prof has underscored Bitcoin’s potential to achieve a new record high, suggesting that it could surge to $80,000 in the near future.
Picks for you
Through an X (formerly Twitter) post on April 12, the analyst highlighted a key metric known as the Mayer Multiple indicator, which signals a bullish trend for Bitcoin. According to the analysis, whenever Bitcoin breaks through a specific threshold on the Mayer Multiple indicator, coinciding with its proximity to or surpassing its all-time high, a parabolic move typically follows shortly after.
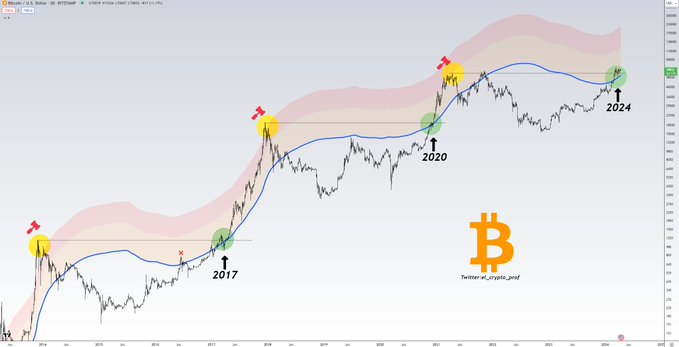
“Many people don’t realise how good BTC currently looks. Whenever BTC has broken through the blue line in the Mayer Multiple-Indicator AND at the same time is close to/or above the ATH, a parabolic move started a short time later. $80,000+ very soon,” he said.
Notably, the Mayer Multiple is a ratio of the current price of Bitcoin to its 200-day moving average. It’s often determines whether Bitcoin is overbought or oversold. When Bitcoin breaks through a certain level of the Mayer Multiple and is also at or near its all-time high, it historically precedes a rapid upward movement in price.
Bitcoin’s short-term volatility eases
Generally, Bitcoin has experienced a decrease in volatility, consolidating above the $70,000 threshold. This period of consolidation aligns with the current market analysis of the unexpectedly high Consumer Price Index (CPI) report and its potential impact on future interest rates and risk assets.
Furthermore, Bitcoin’s sideways price movement corresponds with the stabilization of inflows into spot Bitcoin exchange-traded funds (ETFs) after their initial two months of trading saw record-setting activity levels.
Indeed, the potential stabilization in Bitcoin’s price may serve as a crucial foundation for guiding the cryptocurrency toward a new trajectory, aiming for $80,000.
Bitcoin price analysis
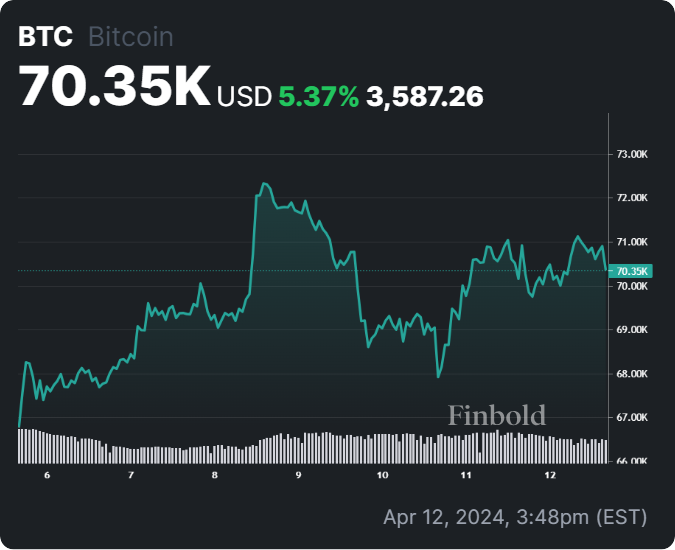
At the time of writing, Bitcoin was exchanging hands at $70,208, experiencing daily losses of nearly 1%. On a weekly timeframe, Bitcoin has surged by more than 5%, reaching a peak of $72,300 on April 8.
While technical indicators suggest a potential upward push towards $80,000, it’s important to note that Bitcoin’s attainment of this milestone is not guaranteed, given its susceptibility to other market fluctuations, notably its inherent volatility.
Disclaimer: The content on this site should not be considered investment advice. Investing is speculative. When investing, your capital is at risk.