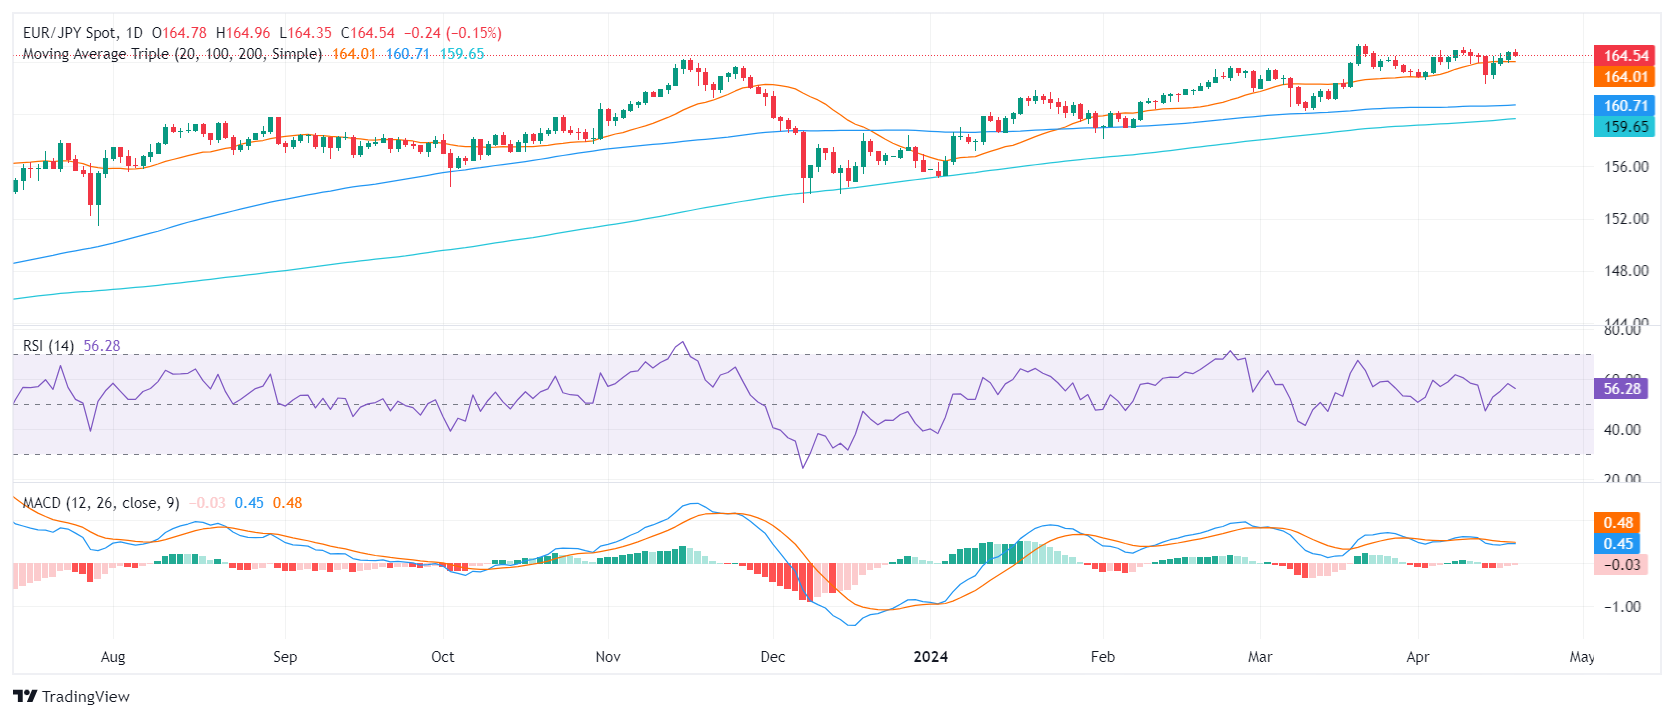
- The RSI on the daily chart of EUR/JPY indicates sustained bullish momentum.
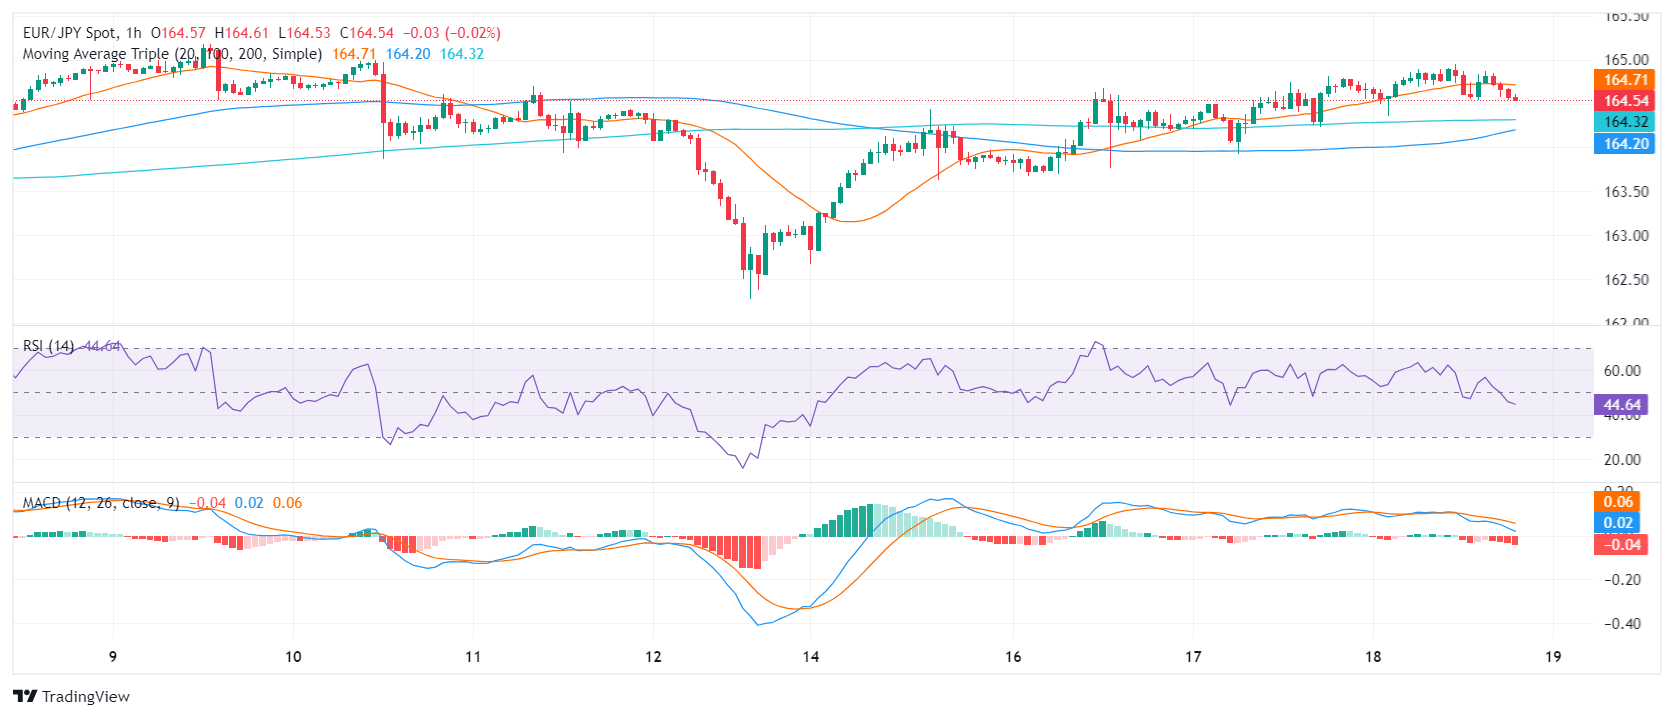
- Hourly chart shows an RSI below its mid-zone and MACD with rising red bars, pointing towards possible consolidation.
- The EUR/JPY's position above main SMAs underscores a strong bullish bias.
The EUR/JPY slightly declined to 164.70 in Thursday’s session. That being said, the overall trend still favors the bulls but a consolidation phase, suggested by bears dominating the hourly chart, may create a balanced playing field for both buyers and sellers ahead of the Asian session.
On the daily chart, the Relative Strength Index (RSI) for the EUR/JPY pair is in positive territory, with a most recent reading of 58. This suggests that the pair's upsurge might remain intact as long as the RSI stays above the 50 mark, indicating that buyers are in control at this moment.
EUR/JPY daily chart
Meanwhile, on the hourly chart, the EUR/JPY's RSI declined below its middle zone, with the latest reading of 44 as of the last hour. This could point towards a pending period of consolidation. The Moving Average Convergence Divergence (MACD) displays rising red bars, also hinting at a temporary slowdown in the bullish momentum.
EUR/JPY hourly chart
Regarding the Simple Moving Average (SMA), the cross EUR/JPY holds strong above its 20, 100, and 200-day SMAs, indicating a bullish stance. That being said the pair must defend the 20-day SMA at 164.00 which is a strong support to maintain the positive short-term outlook.
Information on these pages contains forward-looking statements that involve risks and uncertainties. Markets and instruments profiled on this page are for informational purposes only and should not in any way come across as a recommendation to buy or sell in these assets. You should do your own thorough research before making any investment decisions. FXStreet does not in any way guarantee that this information is free from mistakes, errors, or material misstatements. It also does not guarantee that this information is of a timely nature. Investing in Open Markets involves a great deal of risk, including the loss of all or a portion of your investment, as well as emotional distress. All risks, losses and costs associated with investing, including total loss of principal, are your responsibility. The views and opinions expressed in this article are those of the authors and do not necessarily reflect the official policy or position of FXStreet nor its advertisers. The author will not be held responsible for information that is found at the end of links posted on this page.
If not otherwise explicitly mentioned in the body of the article, at the time of writing, the author has no position in any stock mentioned in this article and no business relationship with any company mentioned. The author has not received compensation for writing this article, other than from FXStreet.
FXStreet and the author do not provide personalized recommendations. The author makes no representations as to the accuracy, completeness, or suitability of this information. FXStreet and the author will not be liable for any errors, omissions or any losses, injuries or damages arising from this information and its display or use. Errors and omissions excepted.
The author and FXStreet are not registered investment advisors and nothing in this article is intended to be investment advice.
Recommended content
Editors’ Picks
EUR/USD declines below 1.0700 as USD recovery continues

EUR/USD lost its traction and declined below 1.0700 after spending the first half of the day in a tight channel. The US Dollar extends its recovery following the strong Unit Labor Costs data and weighs on the pair ahead of Friday's jobs report.
GBP/USD struggles to hold above 1.2500

GBP/USD turned south and dropped below 1.2500 in the American session on Thursday. The US Dollar continues to push higher following the Fed-inspired decline on Wednesday and doesn't allow the pair to regain its traction.
Gold slumps below $2,300 as US yields rebound

Gold extended its daily slide and dropped below $2,290 in the second half of the day on Thursday. The benchmark 10-year US Treasury bond yield erased its daily losses after US data, causing XAU/USD to stretch lower ahead of Friday's US jobs data.
Top 3 Price Prediction BTC, ETH, XRP: Altcoins to pump once BTC bottoms out, slow grind up for now

Bitcoin reclaiming above $59,200 would hint that BTC has already bottomed out, setting the tone for a run north. Ethereum holding above $2,900 keeps a bullish reversal pattern viable despite falling momentum. Ripple coils up for a move north as XRP bulls defend $0.5000.
Happy Apple day

Apple is due to report Q1 results today after the bell. Expectations are soft given that Apple’s Chinese business got a major hit in Q1 as competitors increased their market share against the giant Apple.