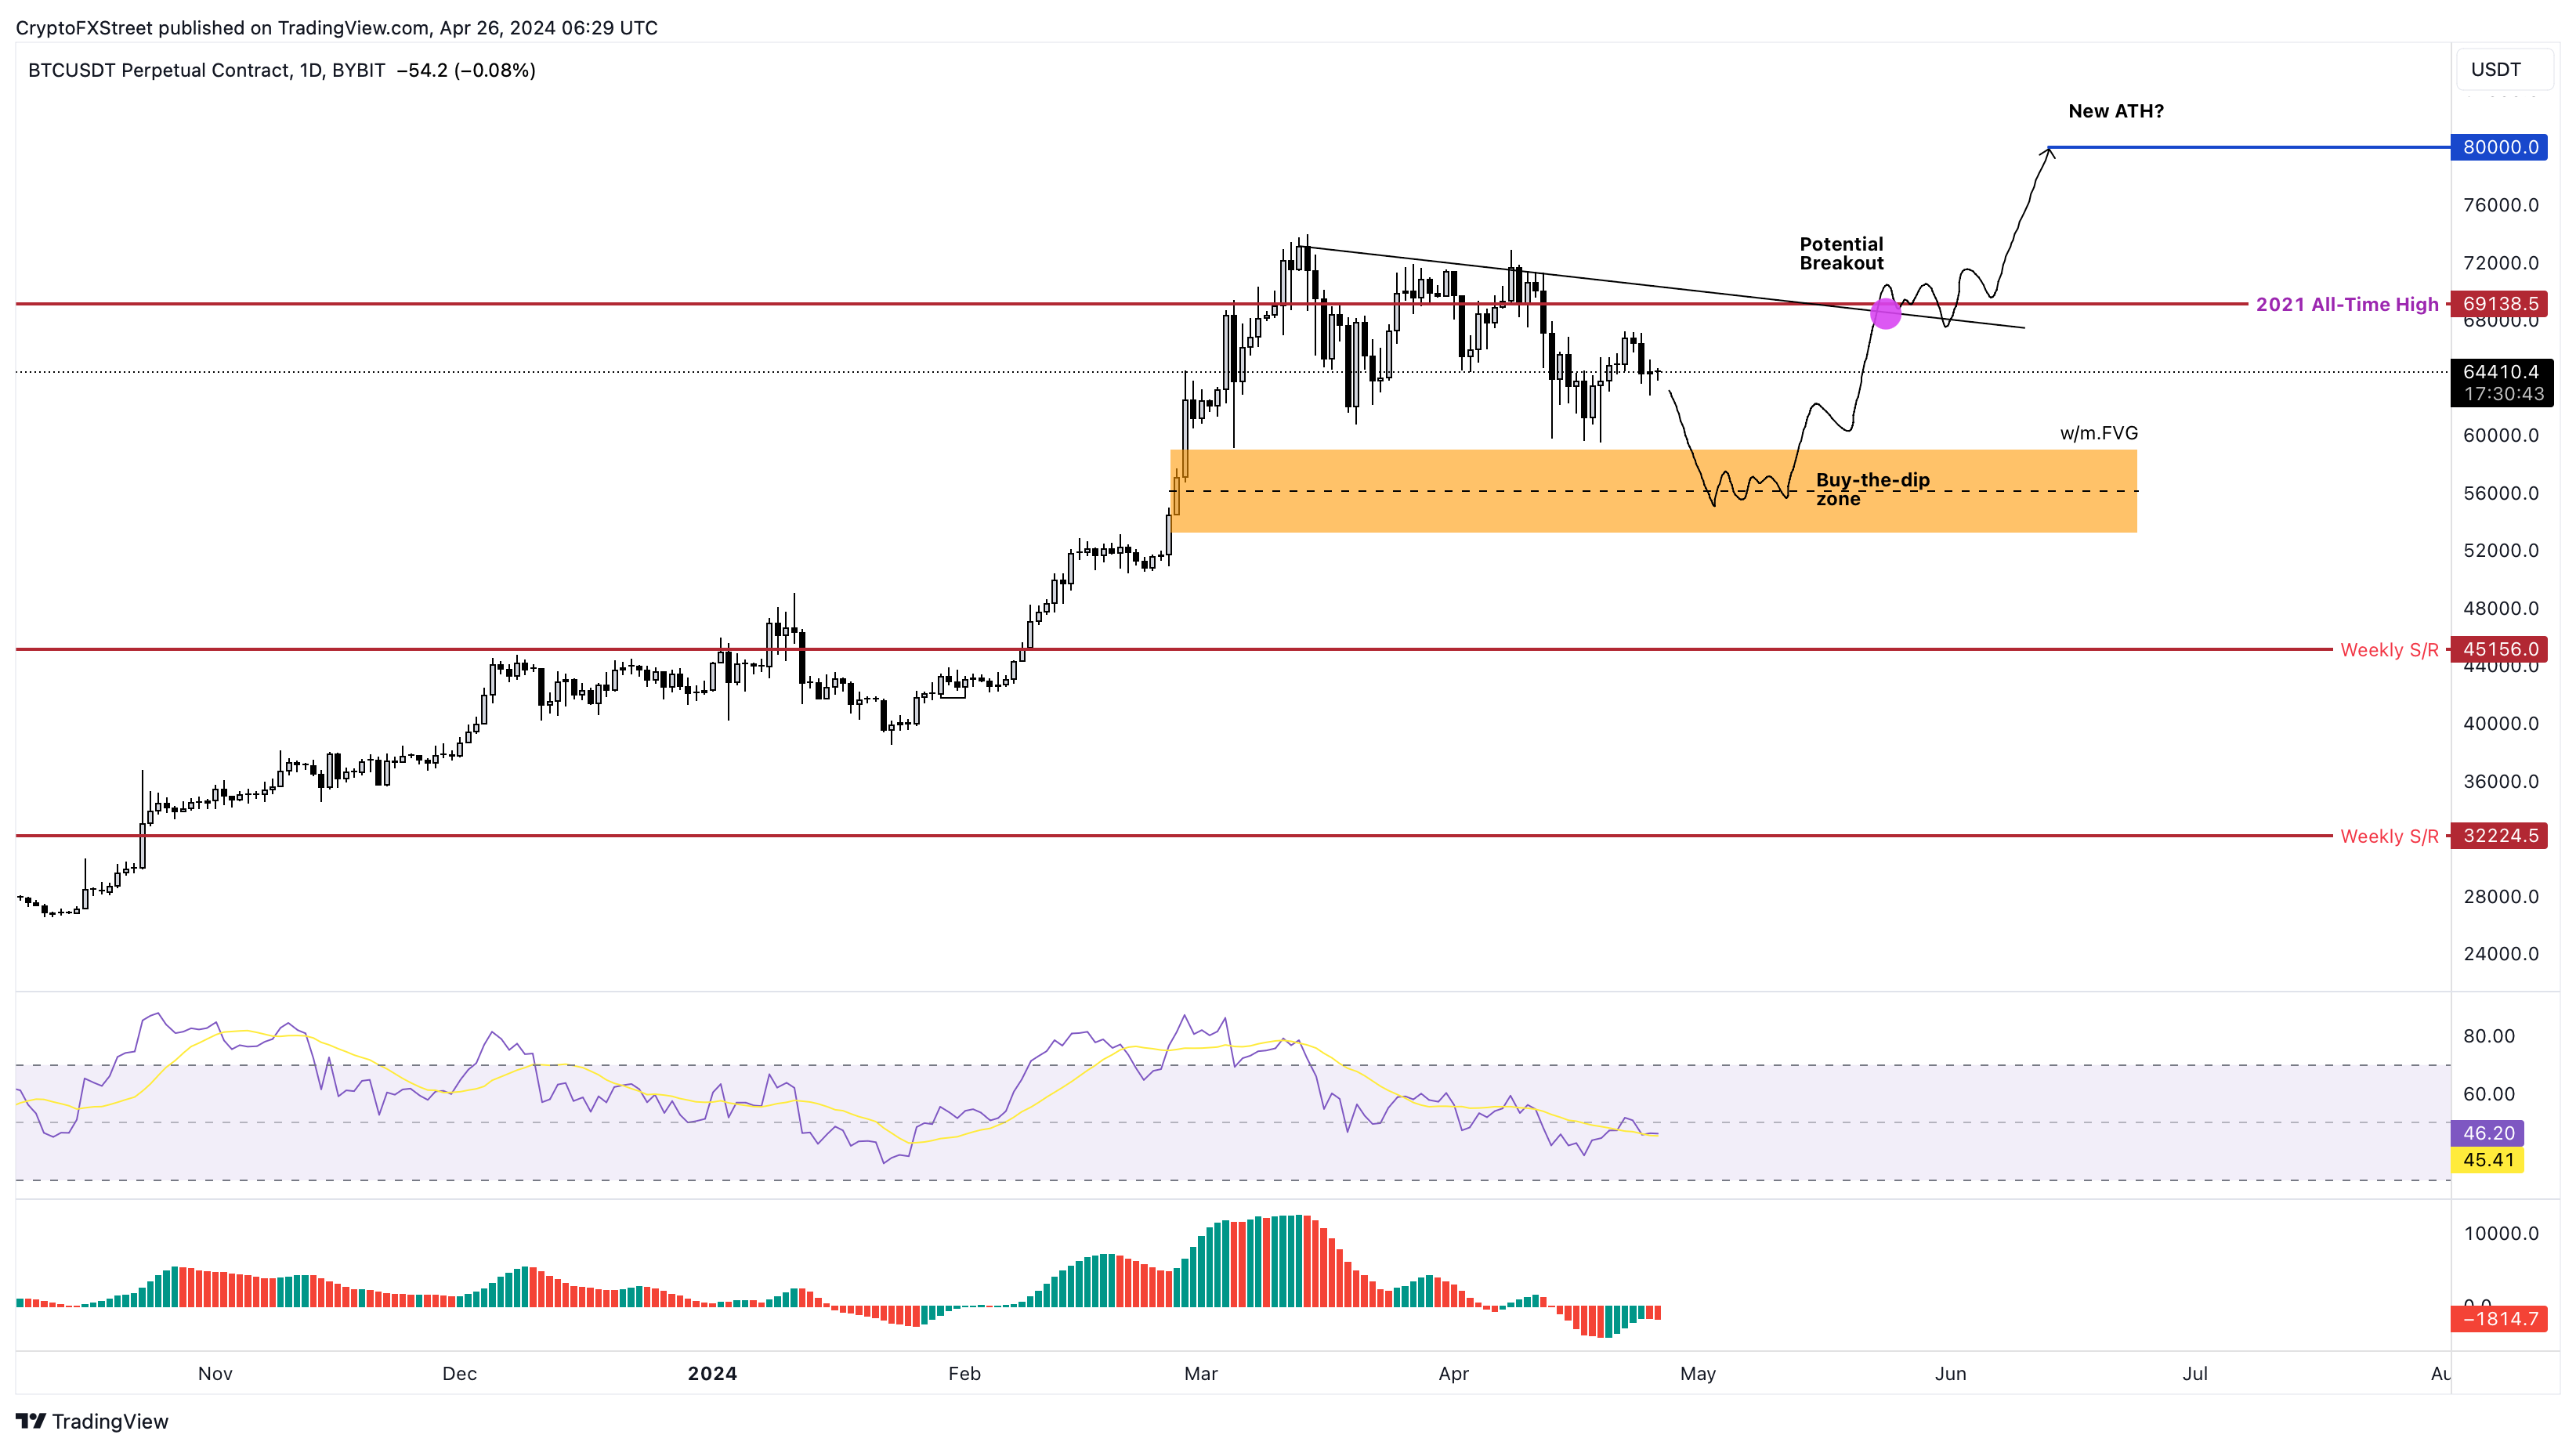
- Bitcoin price is likely to dip into the $59,111 to $53,120 imbalance, allowing sidelined buyers to accumulate.
- A bounce from this zone could propel BTC to $80,000, a new all-time high.
- On-chain metrics support the short-term upswing in BTC.
Bitcoin’s (BTC) recent price consolidation could be nearing its end as technical indicators and on-chain metrics suggest a potential upward breakout. However, this move would not be straightforward and could punish impatient investors.
Also read: Bitcoin Weekly Forecast: BTC post-halving rally could be partially priced in
Bitcoin price sets the stage for next move
Bitcoin price has been hovering above the imbalance on the weekly chart, extending from $59,111 to $53,120, failing to dip into it. As mentioned in previous forecasts, this inefficient zone is key for potential buy-the-dip orders to be triggered. To make the corrective outlook more compelling, investors can observe the set of equal lows formed just above the aforementioned imbalance’s upper limit of $59,111.
The ideal scenario for Bitcoin price to restart its uptrend or the bullish atmosphere is to trigger a correction that sweeps the sell-side liquidity resting below $59,111 and dip into the said imbalance. Depending on the buying pressure here, the recovery rally could turn into a continuation of the bull run.
Assuming buyers step up, Bitcoin price will face resistance around the 2021 highof $69,138. If BTC manages to produce a weekly candlestick close above this level, it will mean the first higher high in the six-week consolidation that has set up three lower highs.
Such a development would not only build confidence in the crypto landscape but also restart the uptrend, potentially pushing BTC to tag the $80,000 psychological level.
The daily Relative Strength Index (RSI) for Bitcoin price has slipped below the 50 mean level and is attempting a comeback. The same can be said for Awesome Oscillator (AO). To be precise, the RSI's current position looks similar to what occurred between late December 2023 and early January 2024. To conclude, although both momentum indicators are not signaling a bullish scenario yet, they are set up to flip bullish if the situation arises.
Read more: Bitcoin bull plans thwarted by US Dollar rally
BTC/USDT 1-week chart
According to Santiment, Bitcoin’s 30-day Market Value to Realized Value (MVRV) ratio currently hovers around -3.00% after recovering from -8.25% in the past few weeks. This indicator is used to determine the average profit or loss of investors who purchased BTC in the past month.
The -3.00% suggests that investors who bought BTC in the past month are sitting at an average loss of -3.00%. Ideally, a positive value serves as a sell signal since it reveals unrealized profits. On the other hand, a negative value denotes a potential buy signal due to the unrealized losses.
Although the MVRV has recovered safely from -10%, it still flashes a potential buy signal. As mentioned above, the technicals are forecasting a short-term drop, which could give sidelined buyers another opportunity to long.
Also read: Week Ahead: Crypto market volatility likely to come back as BTC halving looms
 [11.47.40, 26 Apr, 2024]-638497109347802104.png)
BTC 30-day MVRV
Additionally, the Whale Transaction Count (WTC), which tracks transfers of BTC worth $100,000 or more, showed spikes during the price dips of the ongoing consolidation. This relation clearly indicates that these large investors were moving their money to buy BTC at a discount.
 [11.51.27, 26 Apr, 2024]-638497109545486571.png)
BTC WTC
All in all, Bitcoin price looks like it will trigger a bullish breakout, but investors need to be cautious and wait patiently for a dip. On the other hand, if BTC fails to dip into the $59,111 to $53,120 imbalance, it means that smart money is likely trying to trap early bulls by kick-starting a quick bounce.
If Bitcoin price produces a weekly candlestick close below $53,120, the lower limit of the imbalance zone, it would create a lower low and confirm the persistence of the downtrend. Such a development would invalidate the bullish outlook and potentially lead prices to fall 15% towards the next key support level at $45,156.
Information on these pages contains forward-looking statements that involve risks and uncertainties. Markets and instruments profiled on this page are for informational purposes only and should not in any way come across as a recommendation to buy or sell in these assets. You should do your own thorough research before making any investment decisions. FXStreet does not in any way guarantee that this information is free from mistakes, errors, or material misstatements. It also does not guarantee that this information is of a timely nature. Investing in Open Markets involves a great deal of risk, including the loss of all or a portion of your investment, as well as emotional distress. All risks, losses and costs associated with investing, including total loss of principal, are your responsibility. The views and opinions expressed in this article are those of the authors and do not necessarily reflect the official policy or position of FXStreet nor its advertisers. The author will not be held responsible for information that is found at the end of links posted on this page.
If not otherwise explicitly mentioned in the body of the article, at the time of writing, the author has no position in any stock mentioned in this article and no business relationship with any company mentioned. The author has not received compensation for writing this article, other than from FXStreet.
FXStreet and the author do not provide personalized recommendations. The author makes no representations as to the accuracy, completeness, or suitability of this information. FXStreet and the author will not be liable for any errors, omissions or any losses, injuries or damages arising from this information and its display or use. Errors and omissions excepted.
The author and FXStreet are not registered investment advisors and nothing in this article is intended to be investment advice.
Recommended Content
Editors’ Picks
CAKE price bottoms out as PancakeSwap announces $25 million burn

PancakeSwap’s price increased nearly 3% on Monday after the decentralized exchange platform on the Binance Smart Chain announced a token burn of more than 8.9 million CAKE tokens, collected from trading fees across Automated Market Makers Version 2 and 3 of the platform.
Ripple lawsuit to see SEC response on Monday, XRP nears 4.5 million mark in liquidity pools

Ripple closed above $0.52 on Sunday and resumed its climb on Monday, May 6. Sentiment among market participants is positive as traders await Securities and Exchange Commission response filing and XRP locked in Automated Market Maker liquidity pools crosses 4.31 million.
Crypto AI tokens post near double-digit gains amidst launches from NVIDIA, OpenAI and Amazon
AI-based cryptocurrencies have experienced nearly double-digit or higher gains on Monday, well above the price increases seen among the main crypto assets, likely fuelled by recent announcements of new developments from AI and tech giants in the US.
Addressing the crypto investor dilemma: To invest or not? Premium

Bitcoin’s consolidation crosses the two-month mark but shows no signs of a breakout or a directional move. Investors waiting with bated breath for a volatile move remain confused about whether to buy the dips or keep some cash reserves for a rainy day.
Bitcoin: Should you buy BTC here? Premium

Bitcoin (BTC) price shows signs of a potential reversal but lacks confirmation, which has divided the investor community into two – those who are buying the dips and those who are expecting a further correction.