Soybeans Elliott Wave analysis
Function - Trend.
Mode - Impulse.
Structure - Impulse for (5).
Position - Wave 1 of (5).
Direction - Wave 2 of (5).
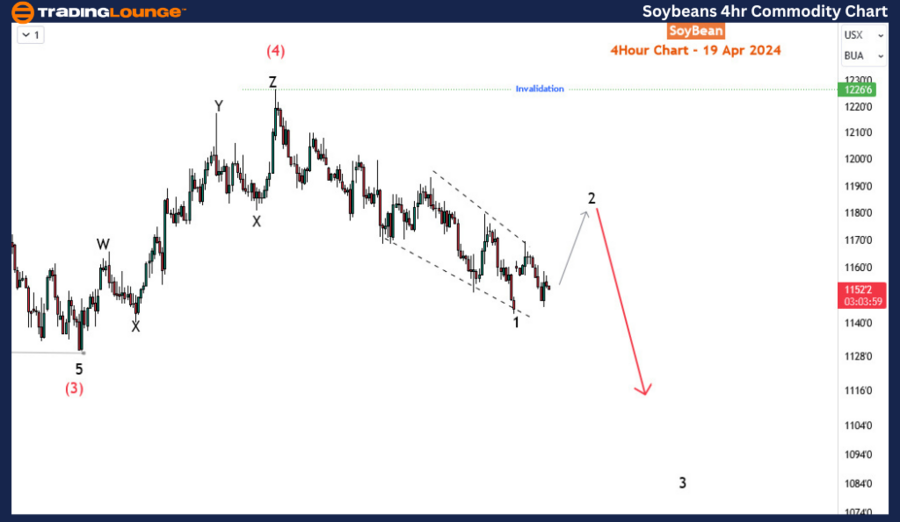
Details - Wave 1 of (5) completing with a diagonal. Wave 2 bounce is emerging before the price turns downside for 3 of (5). Invalidation now at 1226’6. Not much has changed since the last update.
Soybean price analysis: Elliott Wave Perspective Signals Continued Downward Trend
In the realm of commodity trading, Soybean has recently undergone a significant downturn, marking a nearly 7% drop since March 21st. This decline appears to be part of a broader trend that commenced back in June 2022. However, before this recent descent, there was a brief period of respite characterized by a corrective bounce starting in late February.
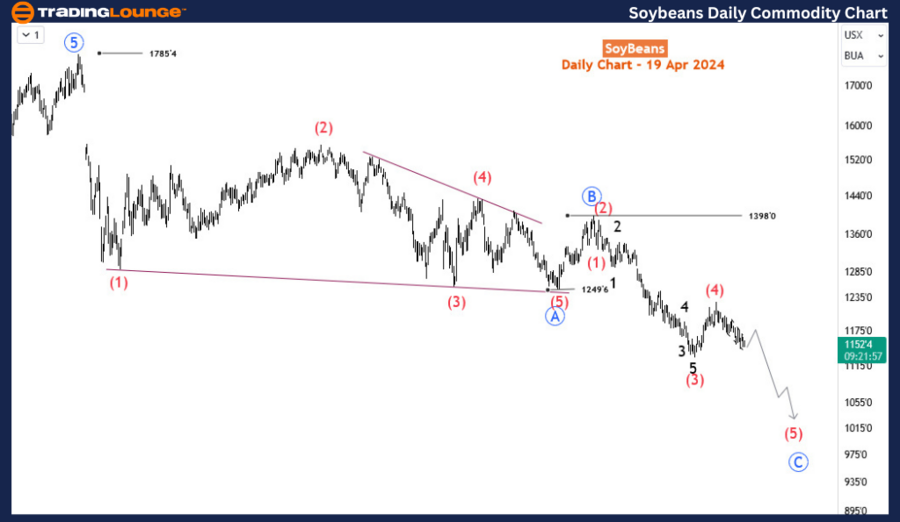
Delving deeper into the price action, an Elliott Wave analysis sheds light on the intricacies of Soybean's movement. The daily chart's decline since June 2022 reveals a corrective pattern, delineated into waves A-B-C, as denoted by blue annotations.
The initial wave, labeled as Blue Wave 'A', terminated at 1249 in October 2023, exhibiting a distinct diagonal pattern. Subsequently, a modest rebound ensued, marked by Blue Wave 'B', which concluded at 1398 in November 2023. However, the ascendancy was short-lived as the bears regained control, manifesting in the ongoing development of Blue Wave 'C'. This wave, evolving into an impulse wave, has currently progressed to wave (5) following the completion of wave (4) in March 2024.
Zooming in on the H4 chart, a granular analysis reveals the sub-waves of wave (5). Wave 1 of (5) concluded with a diagonal structure, followed by a corrective phase as the price undergoes a temporary upside correction to complete wave 2. Despite uncertainties regarding whether wave 2 has fully concluded or will undergo another upward leg, the overarching trajectory remains clear – a downward break is anticipated to continue wave 3 of (5), leading to further downside movement.
In light of this analysis, the prevailing sentiment favors sellers, who continue to assert dominance over the commodity market. As long as the price remains below 1226’6, the outlook remains skewed towards further downside potential, with the possibility of reaching the lowest price point since November 2020.
In conclusion, the Elliott Wave perspective offers valuable insights into Soybean's price dynamics, signaling a continued bearish trajectory in the near term. While short-term fluctuations may occur, the broader trend suggests that sellers are likely to maintain control, shaping the commodity's price action in the foreseeable future.
Soybeans Elliott Wave technical analysis [Video]
As with any investment opportunity there is a risk of making losses on investments that Trading Lounge expresses opinions on.
Historical results are no guarantee of future returns. Some investments are inherently riskier than others. At worst, you could lose your entire investment. TradingLounge™ uses a range of technical analysis tools, software and basic fundamental analysis as well as economic forecasts aimed at minimizing the potential for loss.
The advice we provide through our TradingLounge™ websites and our TradingLounge™ Membership has been prepared without considering your objectives, financial situation or needs. Reliance on such advice, information or data is at your own risk. The decision to trade and the method of trading is for you alone to decide. This information is of a general nature only, so you should, before acting upon any of the information or advice provided by us, consider the appropriateness of the advice considering your own objectives, financial situation or needs. Therefore, you should consult your financial advisor or accountant to determine whether trading in securities and derivatives products is appropriate for you considering your financial circumstances.
Recommended Content
Editors’ Picks
EUR/USD edges lower to near 1.0750 after hawkish remarks from a Fed official

EUR/USD extends its losses for the second successive session, trading around 1.0750 during the Asian session on Wednesday. The US Dollar gains ground due to the expectations of the Federal Reserve’s prolonging higher interest rates.
GBP/USD hovers around 1.2500 on the stronger US Dollar, focus on BoE rate decision

The GBP/USD pair trades on a softer note around 1.2500 on Wednesday during the Asian session. The USD Index recovers modestly to 105.40, which drags the major pair lower. Investors focus on the upcoming Bank of England's monetary policy meeting.
Gold price recovers its recent losses, despite a firmer US Dollar

Gold price attracts some buyers during the Asian trading hours on Wednesday. Safe-haven demand, fueled by geopolitical tensions and uncertainty, as well as ongoing central bank purchases, might contribute to a rally in gold.
Ethereum resume sideways move as Grayscale files to withdraw Ethereum futures ETF application with the SEC
Ethereum is hinting at a resumption of a sideways movement on Tuesday after seeing inflows for the first time in seven weeks. Grayscale withdrew its application for an Ethereum futures ETF, and the SEC’s Chair Gary Gensler has also called most crypto assets securities.
No obvious macro catalysts to steer the bus

The US data calendar remains relatively light, with initial jobless claims and the University of Michigan survey being the key focus. However, these releases may not provide a significant catalyst for the next directional move in the US Dollar.