Abstract and Introduction
Introduction
Injection-drug users (IDUs) acquire human immunodeficiency virus (HIV) infection by sharing drug equipment with HIV-infected persons and by engaging in risky sexual behavior. In 2007, injection-drug use was the third most frequently reported risk factor for HIV infection in the United States, after male-to-male sexual contact and high-risk heterosexual contact.[1] To characterize HIV-infected IDUs aged ≥13 years in the United States, CDC analyzed data from the national notifiable disease reporting system for 2004–2007 from the 34 states that had conducted confidential, name-based HIV surveillance since at least 2003. The results of that analysis indicated that, during 2004–2007, 62.2% of IDUs with a new diagnosis of HIV infection were males, 57.5% were blacks or African Americans, and 74.8% lived in urban areas at the time of their HIV diagnosis. In addition, during 2004–2006, approximately 40% of HIV-infected IDUs received late HIV diagnoses (i.e., diagnosis of acquired immunodeficiency syndrome [AIDS] < 12 months after the date of HIV diagnosis). To reduce the prevalence of HIV infection and late HIV diagnosis among IDUs, HIV prevention programs serving IDUs should have comprehensive approaches that incorporate access to HIV testing as part of community-based outreach, drug abuse treatment, and syringe exchange programs.
HIV infection and AIDS are notifiable diseases in all 50 states, the District of Columbia, and five U.S. territories.Although all states have had AIDS reporting since the early 1980s, HIV surveillance with uniform reporting was not implemented in all states until 2008.* CDC regards data from states with confidential, name-based, HIV surveillance systems as sufficient to monitor trends and estimate risk behaviors for HIV infection after 4 continuous years of reporting.[1] The HIV and AIDS diagnosis data for IDUs in this report were obtained from case report forms from the 34 states† with such reporting since December 2003.
The data in this report represent IDUs who received a new diagnosis of HIV infection, regardless of when that infection was acquired. Data were adjusted for reporting delays (i.e., the time between diagnosis and report); IDU risk factor information was imputed for persons without sufficient information.[1] IDUs who also were categorized as men who have sex with men (MSM) were excluded from the analysis. The number and percentage of IDUs who received HIV diagnoses were estimated by sex, age, race/ethnicity, and area of residence at time of HIV diagnosis. Area of residence was categorized as urban (≥500,000 population), suburban (50,000–499,999), or rural (nonmetropolitan area).
Because no standard national population estimates exist for IDUs, calculation of new HIV diagnosis rates used 2007 general population estimates from the U.S. Census.§ In addition, to identify characteristics associated with late diagnosis of HIV infection, stratified multivariate analyses using log-binomial models were conducted to estimate prevalence ratios by sex and age group in the three racial/ethnic populations with the most HIV-infected IDUs (whites, blacks or African Americans, and Hispanics or Latinos). An HIV diagnosis was considered late if diagnosis of AIDS was received < 12 months after the date of HIV diagnosis.
During 2004–2007, a total of 152,917 persons received a diagnosis of HIV infection in the 34 states, including 19,687 (12.9%) IDUs. The majority of HIV-infected IDUs (62.2%) were males (Table 1). By age group, the highest percentage of HIV diagnoses among IDUs (33.2%) was observed among persons aged 35–44 years. By race/ethnicity,¶ blacks or African Americans accounted for 11,321 (57.5%) of HIV-infected IDUs, whites for 4,216 (21.4%), Hispanics or Latinos for 3,764 (19.1%), American Indians or Alaska Natives for 117 (0.6%), Asians for 79 (0.4%), and Native Hawaiians or Other Pacific Islanders for 10 (0.1%). The average annual rate of new HIV infection diagnosis per 100,000 general population during 2004–2007 was 11.0 for black or African American IDUs, 4.9 per 100,000 for Hispanics or Latinos, and 0.9 per 100,000 for whites (Table 1).
By area of residence, 14,726 (74.8%) IDUs with a new HIV diagnosis lived in urban areas (Table 1). By race/ethnicity and sex, male blacks or African Americans (17.3) had the highest average annual rate of new HIV diagnosis per 100,000 general population during 2004–2007, followed by female black or African Americans (9.3), male Hispanics or Latinos (7.0), and female Hispanics or Latinos (2.7) (Figure).
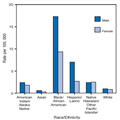
Figure.
Estimated average annual rate* of new diagnoses of human immunodeficiency virus (HIV) infection† among injection-drug users (IDUs),§ by race/ethnicity and sex — 34 states,¶ 2004–2007**
*Per 100,000 general population.
†Case definitions and additional information regarding HIV reporting available at http://www.cdc.gov/hiv/topics/surveillance/resources/reports/2007report/technicalnotes.htm.
§Excludes persons categorized as IDUs/men who have sex with men.
¶Data were reported by 34 states with confidential, name-based reporting since at least December 2003: Alabama, Alaska, Arizona, Arkansas, Colorado, Florida, Georgia, Idaho, Indiana, Iowa, Kansas, Louisiana, Michigan, Minnesota, Mississippi, Missouri, Nebraska, Nevada, New Jersey, New Mexico, New York, North Carolina, North Dakota, Ohio, Oklahoma, South Carolina, South Dakota, Tennessee, Texas, Utah, Virginia, West Virginia, Wisconsin, and Wyoming.
**Includes persons (N = 19,507) who received a diagnosis of HIV infection with or without acquired immunodeficiency syndrome. Data as of June 2008, adjusted for reporting delays and missing IDU risk factor information.
During 2004–2006, approximately 40% of the estimated 14,715 IDUs with HIV received late diagnoses. In each of the three racial/ethnic populations analyzed (whites, blacks or African Americans, and Hispanics or Latinos), higher percentages of males received a late diagnosis than females (Table 2). Compared with persons aged 13–24 years, higher percentages of persons in older age groups received a late diagnosis of HIV infection (Table 2).
Morbidity and Mortality Weekly Report. 2009;58(46):1291-1295. © 2009 Centers for Disease Control and Prevention (CDC)
Cite this: HIV Infection among Injection-drug Users — 34 States, 2004–2007 - Medscape - Nov 27, 2009.


Comments