(MENAFN- DailyFX) US Dollar Talking Points: - The US Dollar gained each day of last week as buyers showed-up to reverse a prior three-week pullback. The big question at this point is whether bulls can continue to press-up to fresh monthly highs, or whether last week's resistance holds as another lower-high, similar to what had happened earlier in the month.
- US Dollar strength showed in an uneven manner last week, with pairs likeGBP/USD ,AUD/USDandNZD/USDall breaking away to set fresh lows. Moves inEUR/USDorUSD/CAD , however, were far more subdued around themes of USD-strength, making for an interesting backdrop as we trade into this week.
- DailyFX Forecasts are published on a variety of currencies such asGold , theUS Dollarorthe Euro and are available from theDailyFX Trading Guides page . If you're looking to improve your trading approach, check outTraits of Successful Traders . And if you're looking for an introductory primer to the Forex market, check out ourNew to FX Guide .
Do you want to see how retail traders are currently trading the US Dollar? Check out ourIG Client Sentiment Indicator .
US Dollar Struggles at 98, Can Bulls Continue to Push? Last week was a strong showing for the US Dollar as the currency put in gains each day Monday through Friday. This quelled a pullback that had lasted for much of the prior three weeks, following a failure to push beyond the yearly-high that was set in late-April. This strength, however, appears to have been unevenly distributed as a number of currency pairs experienced significant sell-offs while the moves elsewhere were more subdued in nature. Pairs like GBP/USD, NZD/USD and AUD/USD showed large moves on their respective charts as US Dollar strength ran rampant. But in pairs like EUR/USD or USD/CAD, last week's move in the Greenback appears to be a bit more tame. Below, I parse through each of these major currency pairs in the effort of devising strategy for the week ahead.
US Dollar Daily Chart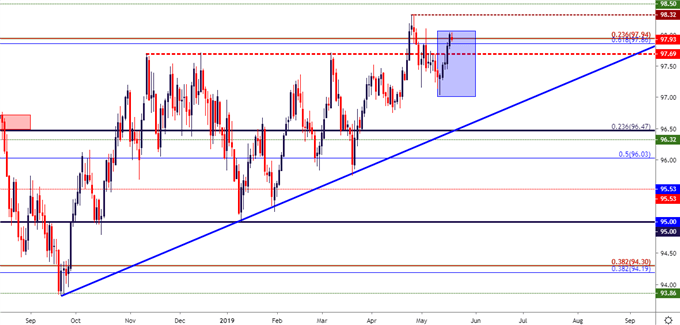 Chart prepared byJames Stanley
US Dollar Outlook: Can Bulls Maintain? The big question for this week is whether the US Dollar powers up for a test of the yearly-high around 98.32, or whetherDXYends up posting another lower-high, similar to what happened in early-May. That lower-high came-in around 98.10, and price action put in a respectable effort to re-test that level last week. But, at this point, buyers have fallen short and the currency has pulled back to start this week.
There are a couple of areas of relevance for pullback themes: Prices are currently testing a confluent zone between two Fibonacci levels of 97.86 and 97.94. A bit-lower, the prior yearly-high around 97.70 can be connected up to last week's higher-low around 97.76.
US Dollar Two-Hour Price Chart
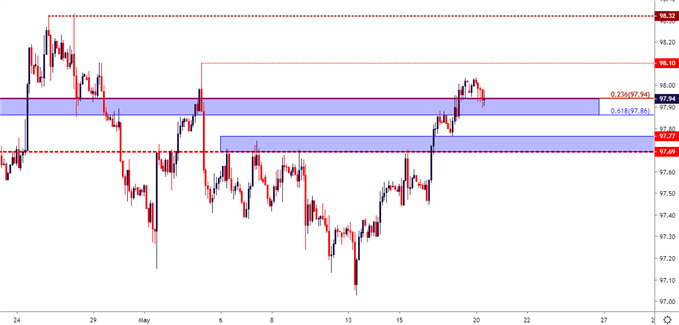
Chart prepared byJames Stanley
EUR/USD Falls Back Below Long-Term Support Last week started optimistically forEurobulls, as EUR/USD pushed up for a re-test of the resistance zone that runs from 1.1250-1.1262. But, similar to what was seen earlier this month, sellers responded at that area and took control of the matter, pushing prices back-below the prior support zone that held the range in the pair for the prior six months. Also similar to early-May, sellers failed to push down to a fresh low following that resistance reaction, and at this point, traders have to contend with yet another higher-low on the chart, making the prospect of bearish continuation strategies a bit less-attractive.
European parliamentary elections take place this week, and ECB meeting minutes from last month's meeting are released on Thursday. For traders looking to fade last week's run of strength in the Greenback, reversal strategies may soon become attractive here. For those that are retaining a bearish EUR/USD bias, a pullback to resistance at that prior zone of support could re-open the door for such themes.
EUR/USD Four-Hour Price Chart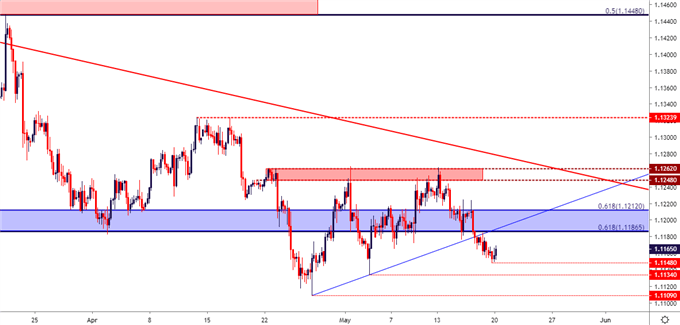 Chart prepared byJames Stanley
GBP/USD Poses Breakdown as USD Strength Runs Rampant One area where USD-bulls were not nearly as shy last week was against theBritish Pound . After starting the month of May on an upbeat note, sellers attacked to push the currency lower every day of the week. The pair is now testing fresh four-month-lows at a big area of support that runs from 1.2671-1.2721, with the latter of those prices as the 14.4% Fibonacci retracement of the April 2018 – January 2019 sell-off.
Below current price action, the 1.2671 level remains of interest for short-term support, and below that, 1.2620 and 1.2525 show as possible supports. For those looking for a pullback to sell-into, prior price action swings around 1.2771 and 1.2829 remain of interest for near-term resistance.
GBP/USD Four-Hour Price Chart
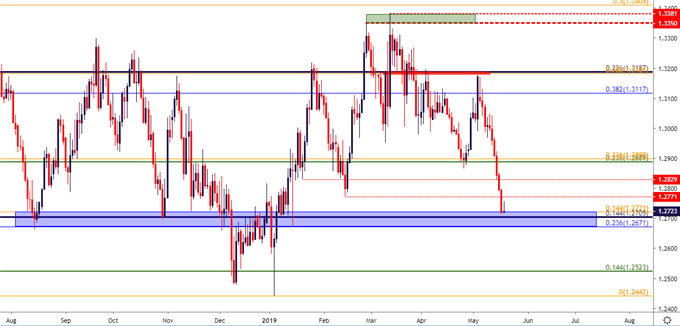
Chart prepared byJames Stanley
USD/CAD Holds 1.3500 Resistance USD/CAD remained remarkably subdued last week given the backdrop in the US Dollar, as USD/CAD continued to grind near resistance around the psychologically important price of 1.3500. This can keep the pair as one of the more interesting markets to follow for themes of USD-weakness. Current support is showing around 1.3423, which is the 78.6% retracement of the May-September 2017 major move. A little-lower is a confluent support zone that runs from 1.3361-1.3385, with the 1.3375 Fibonacci level catching two support bounces over the previous month.
Will the third test see prices finally break-below? If so, the 1.3325 area lurks for the next stop of support potential.
USD/CAD Four-Hour Price Chart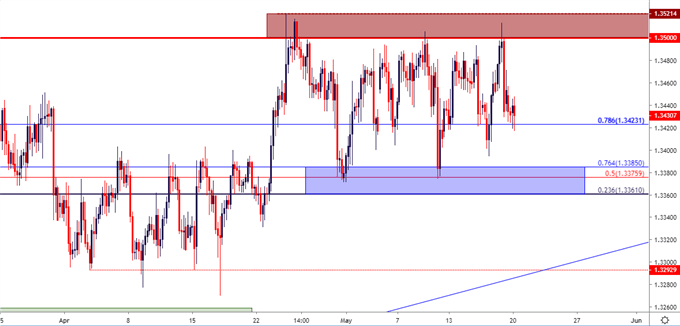 Chart prepared byJames Stanley
AUD/USD: Unfilled Gap Remains After a Brutal Week Last week was rough for theAustralian Dollarwith losses on each day Monday-Friday. After clinging to the .7000 level coming into the month of May, last week is when sellers were finally able to make a break-away on the chart to push down to fresh four-month-lows.
Sellers were perhaps a bit exhausted after last week's showing, and for this week prices gapped-higher. At this point, some unfilled gap remains, begging the question as to whether or not sellers are on the sidelines waiting to push down to fresh lows. This can expose an area on the chart that can be used for tactical purposes: If support does show around this week's gap, exposing the potential for a higher-low, reversal strategies could come into favor with stops below last week's low. And if that low is taken out and the stop is hit on reversal setups, the door could then re-open to bearish continuation scenarios, looking for fresh lows. The price of .6827 remains of interest for next stops of support, and below that, the .6750 area remains of interest, as this is very near the price that held the lows after the opening year flash crash.
AUD/USD Two-Hour Price Chart
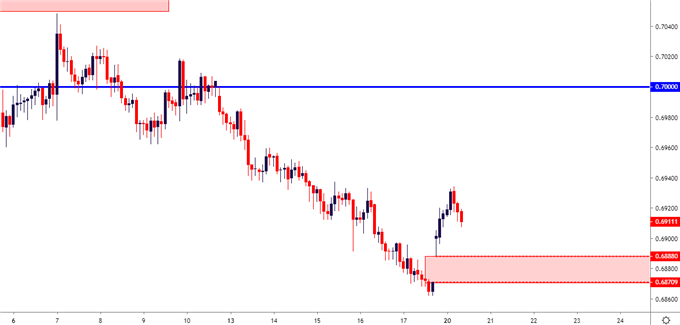
Chart prepared byJames Stanley
NZD/USD Attempts to Cauterize Support Around .6500 Psychological Level Similar to AUD/USD above, last week was a brutal showing for theNew Zealand Dollar . The primary difference at this point, at least from a short-term perspective, is the fact that NZD/USD has already filled its opening gap. Current support is showing just above the .6500 psychological level, taken from the 76.4% Fibonacci retracement of the 2015-2017 major move. This price was last in play around the November open, when price action set a higher-low before a 450 pip rally that held into the December open.
NZD/USD Four-Hour Price Chart
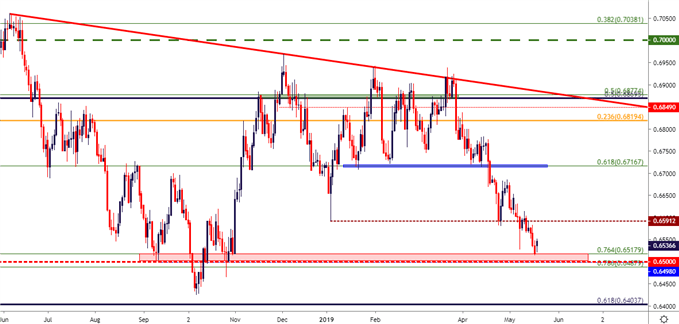
Chart prepared byJames Stanley
To read more: Are you looking for longer-term analysis on the U.S. Dollar? OurDailyFX Forecasts have a section for each major currency, and we also offer a plethora of resources onGoldorUSD -pairs such asEUR/USD ,GBP/USD ,USD/JPY ,AUD/USD . Traders can also stay up with near-term positioning via ourIG Client Sentiment Indicator .
Forex Trading Resources
DailyFX offers an abundance of tools, indicators and resources to help traders. For those looking for trading ideas, ourIG Client Sentimentshows the positioning of retail traders with actual live trades and positions. Ourtrading guidesbring our DailyFX Quarterly Forecasts and our Top Trading Opportunities; and ourreal-time news feedhas intra-day interactions from the DailyFX team. And if you're looking for real-time analysis, ourDailyFX Webinarsoffer numerous sessions each week in which you can see how and why we're looking at what we're looking at.
If you're looking for educational information, ourNew to FX guideis there to help new(er) traders while ourTraits of Successful Traders researchis built to help sharpen the skill set by focusing on risk and trade management.
--- Written by James Stanley, Strategist for DailyFX.com
Contact and follow James on Twitter:@JStanleyFX
DailyFX
MENAFN2005201900760000ID1098546146