


GBP/USD Technical Analysis
- British Pound price action against US Dollar.
- Cable chart and analysis

GBP/USD Price – Weak Uptrend Move
Last week, GBP/USD rallied to 1.3284 – its highest level in two weeks. However, the price slipped and settled below 1.3200 handle. On Friday, Cable closed with a Doji pattern indicating market’s indecision at this stage.
The Relative Strength Index (RSI) fell from 63. However, remained above 50 reflecting that uptrend momentum were still intact.
Just getting started? See our Beginners’ Guide for FX traders
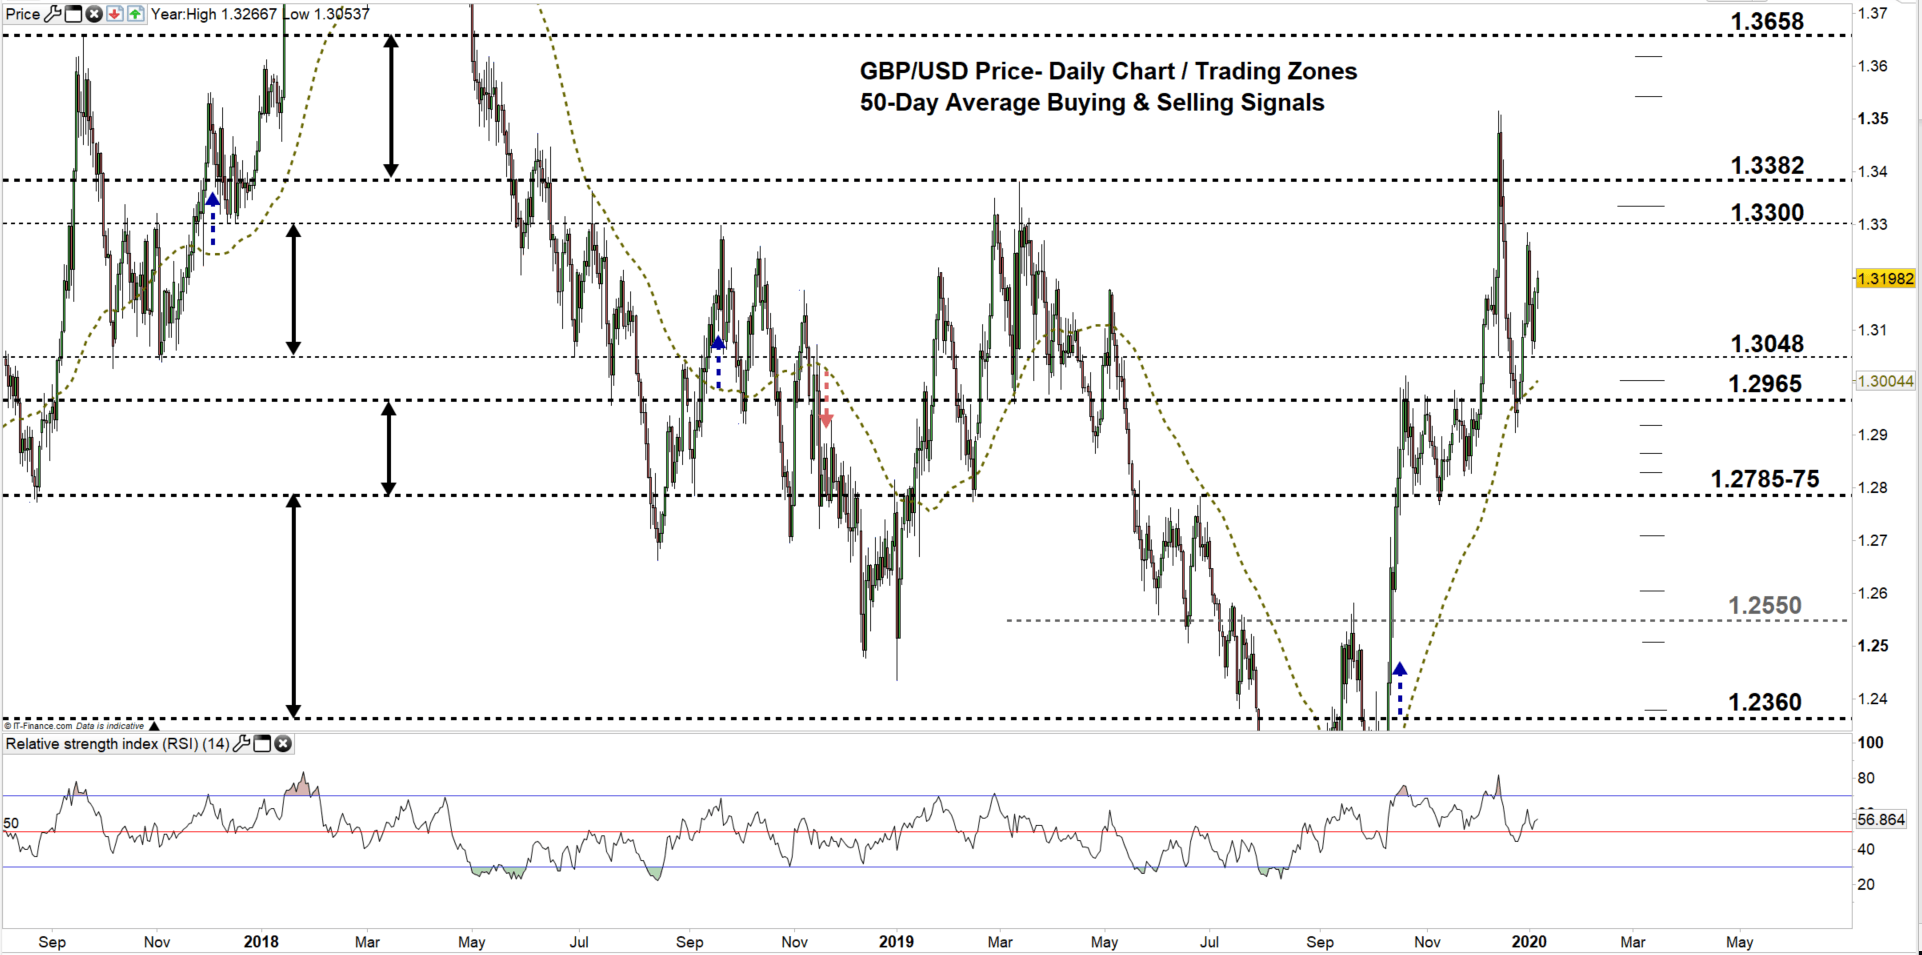
GBP/USD DAILY PRICE CHART (April 25, 2017 – Jan 7, 2020) Zoomed out
GBP/USD DAILY PRICE CHART (Oct 15 – Jan 7, 2020) Zoomed IN
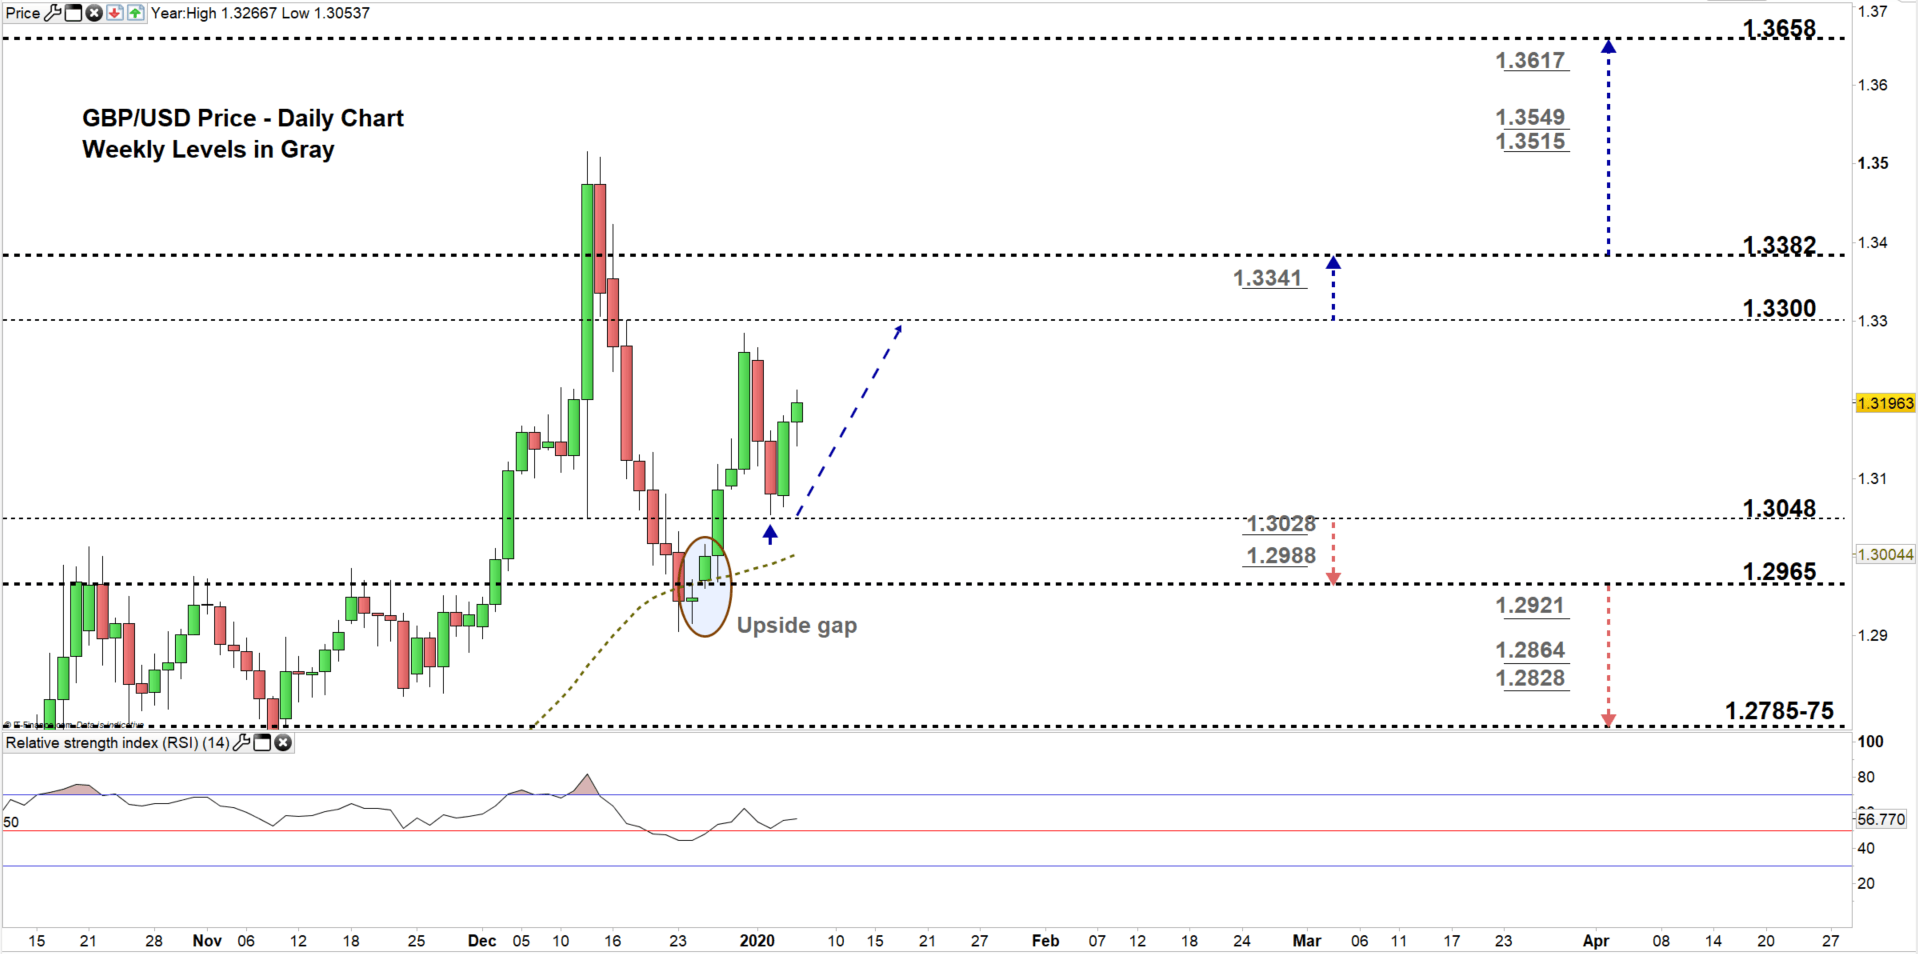
From the daily chart, we notice on Dec 26 GBP/USD opened with a gap to the upside then closed above the 50-Day average signaling buyer’s comeback. On the following day, GBPUSD rallied to a higher trading zone 1.3048 – 1.3300. On Friday, the pair rebounded before testing the low end of the zone indicating that majority of buyers were still holding positions.
Thus, the price could be on its way for a test of the high end of the zone. Any close above the high end might send GBP/USD towards 1.3382. In that scenario, the rally could weaken at the weekly resistance level marked on the chart as some buyers could take profit at this point.
That said, a close below the low end of the zone highlights more buyers exiting the market. This may lead GBPUSD towards 1.2965. Nevertheless, the weekly support levels underlined on the chart (zoomed in) should be considered.

GBP/USD Four Hour PRICE CHART (DEC 11 – Jan 7, 2020)
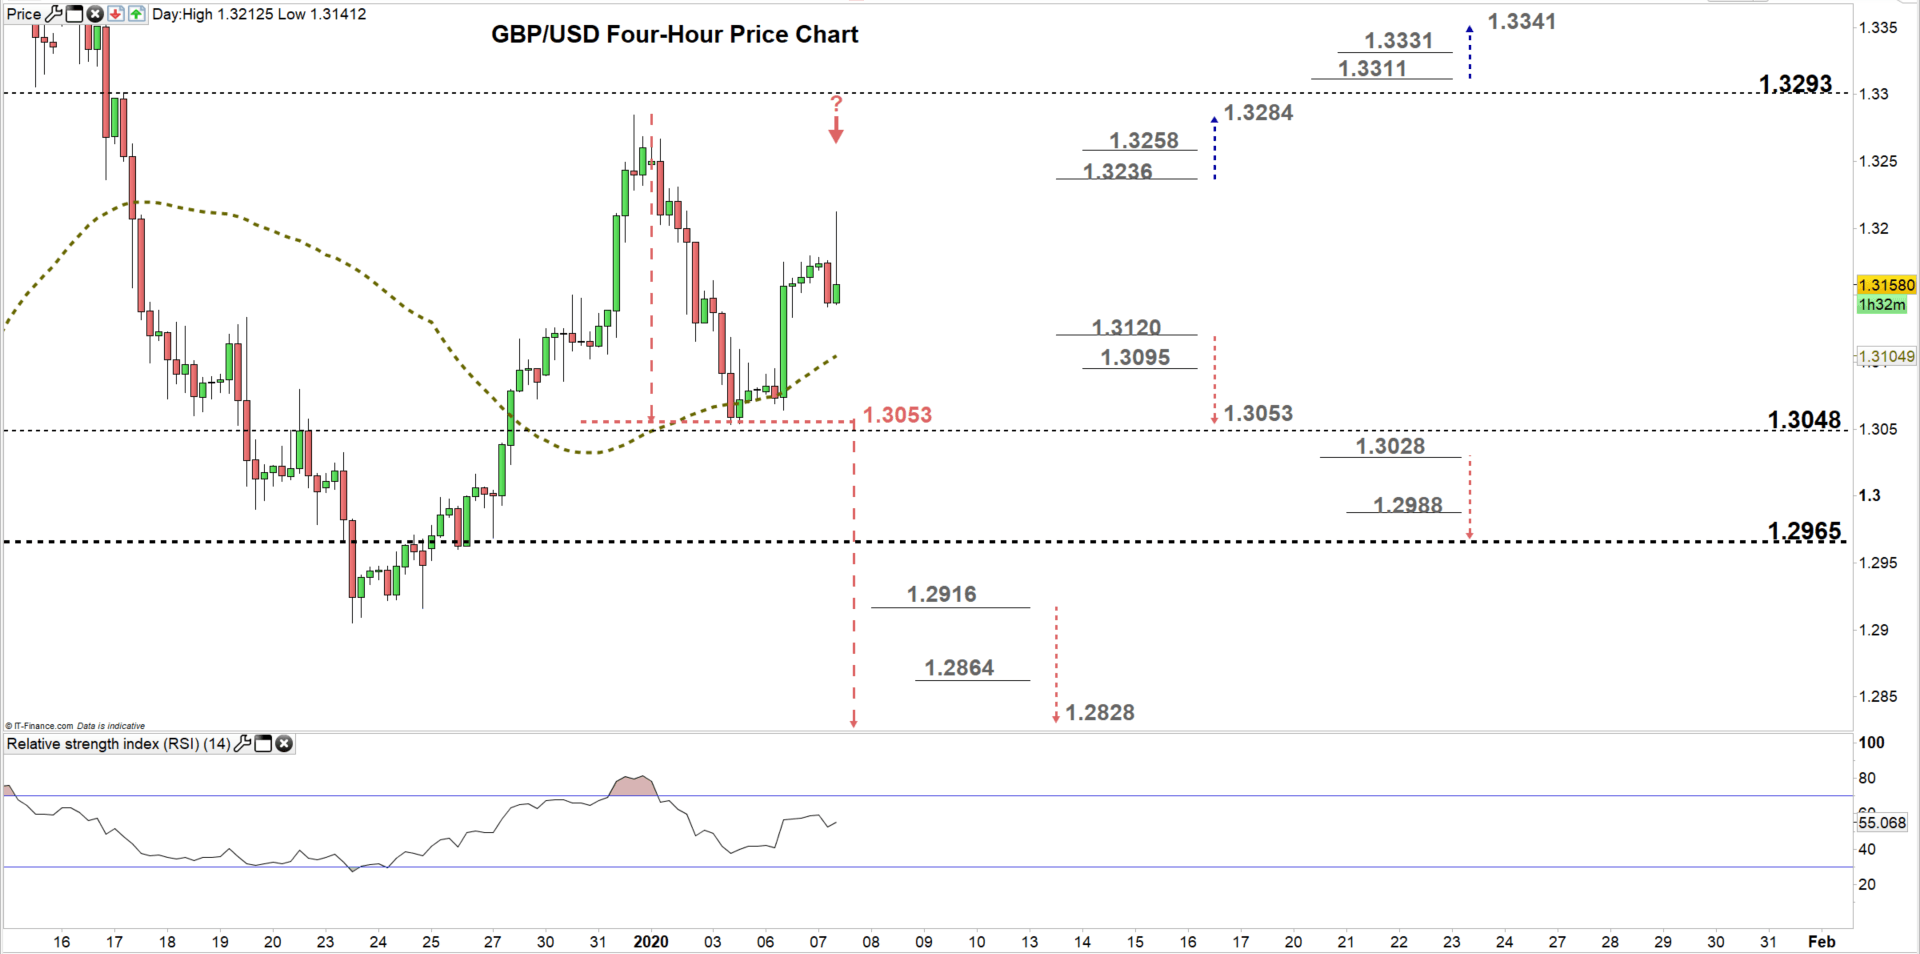
Looking at the four-hour chart, we notice that GBP/USD could be developing a double top pattern. Therefore, any violation to the neckline located at 1.3053 could lead the price towards 1.2828.
A break above 1.3236 may cause a rally towards 1.3284. Although, the daily resistance level underlined on the chart should be watched closely. On the other hand, a break below 1.3120 could send Cable towards 1.3053. Yet, the daily support level underscored on the chart would be worth monitoring.
See the chart to find out more about key levels GBPUSD would encounter in a further bearish /bullish scenario.
Having trouble with your trading strategy? Here’s the #1 Mistake That Traders Make
Written By: Mahmoud Alkudsi
Please feel free to contact me on Twitter: @Malkudsi


