- USD/JPY exchange rate continued to print new yearly highs while some US indexes also created new all-time highs.
- Rate increases a probable catalyst for noise traders.
US Indexes sell-off on Powell commentary and Fed outlook
The New York FX session has shown to be a very volatile one during the first half of the day. Traders have seen the Dow down nearly -1%, the S&P down nearly 1% and the Nasdaq just shy of -2%. Pundits at Fox Business and CNBC have cited raising rates as a catalyst for the selloff. These may be concerns that arose from Fed Chairman Jerome Powell’s recent comments. Fox Business quoted Powell saying the economy has a, “remarkably positive outlook.” Powell also commented on the Federal Reserve’s forecast and outlook. Powell stated, “Since 1950, the US economy has experienced periods of low, stable inflation and periods of very low unemployment, but never both for such an extended time as is seen in these forecasts.” More importantly, Powell stated that the Fed is, “a long way from getting rates to neutral,” solidifying speculation that rates will continue to rise in the future.
USD/JPY follows US equity markets, selling of lower
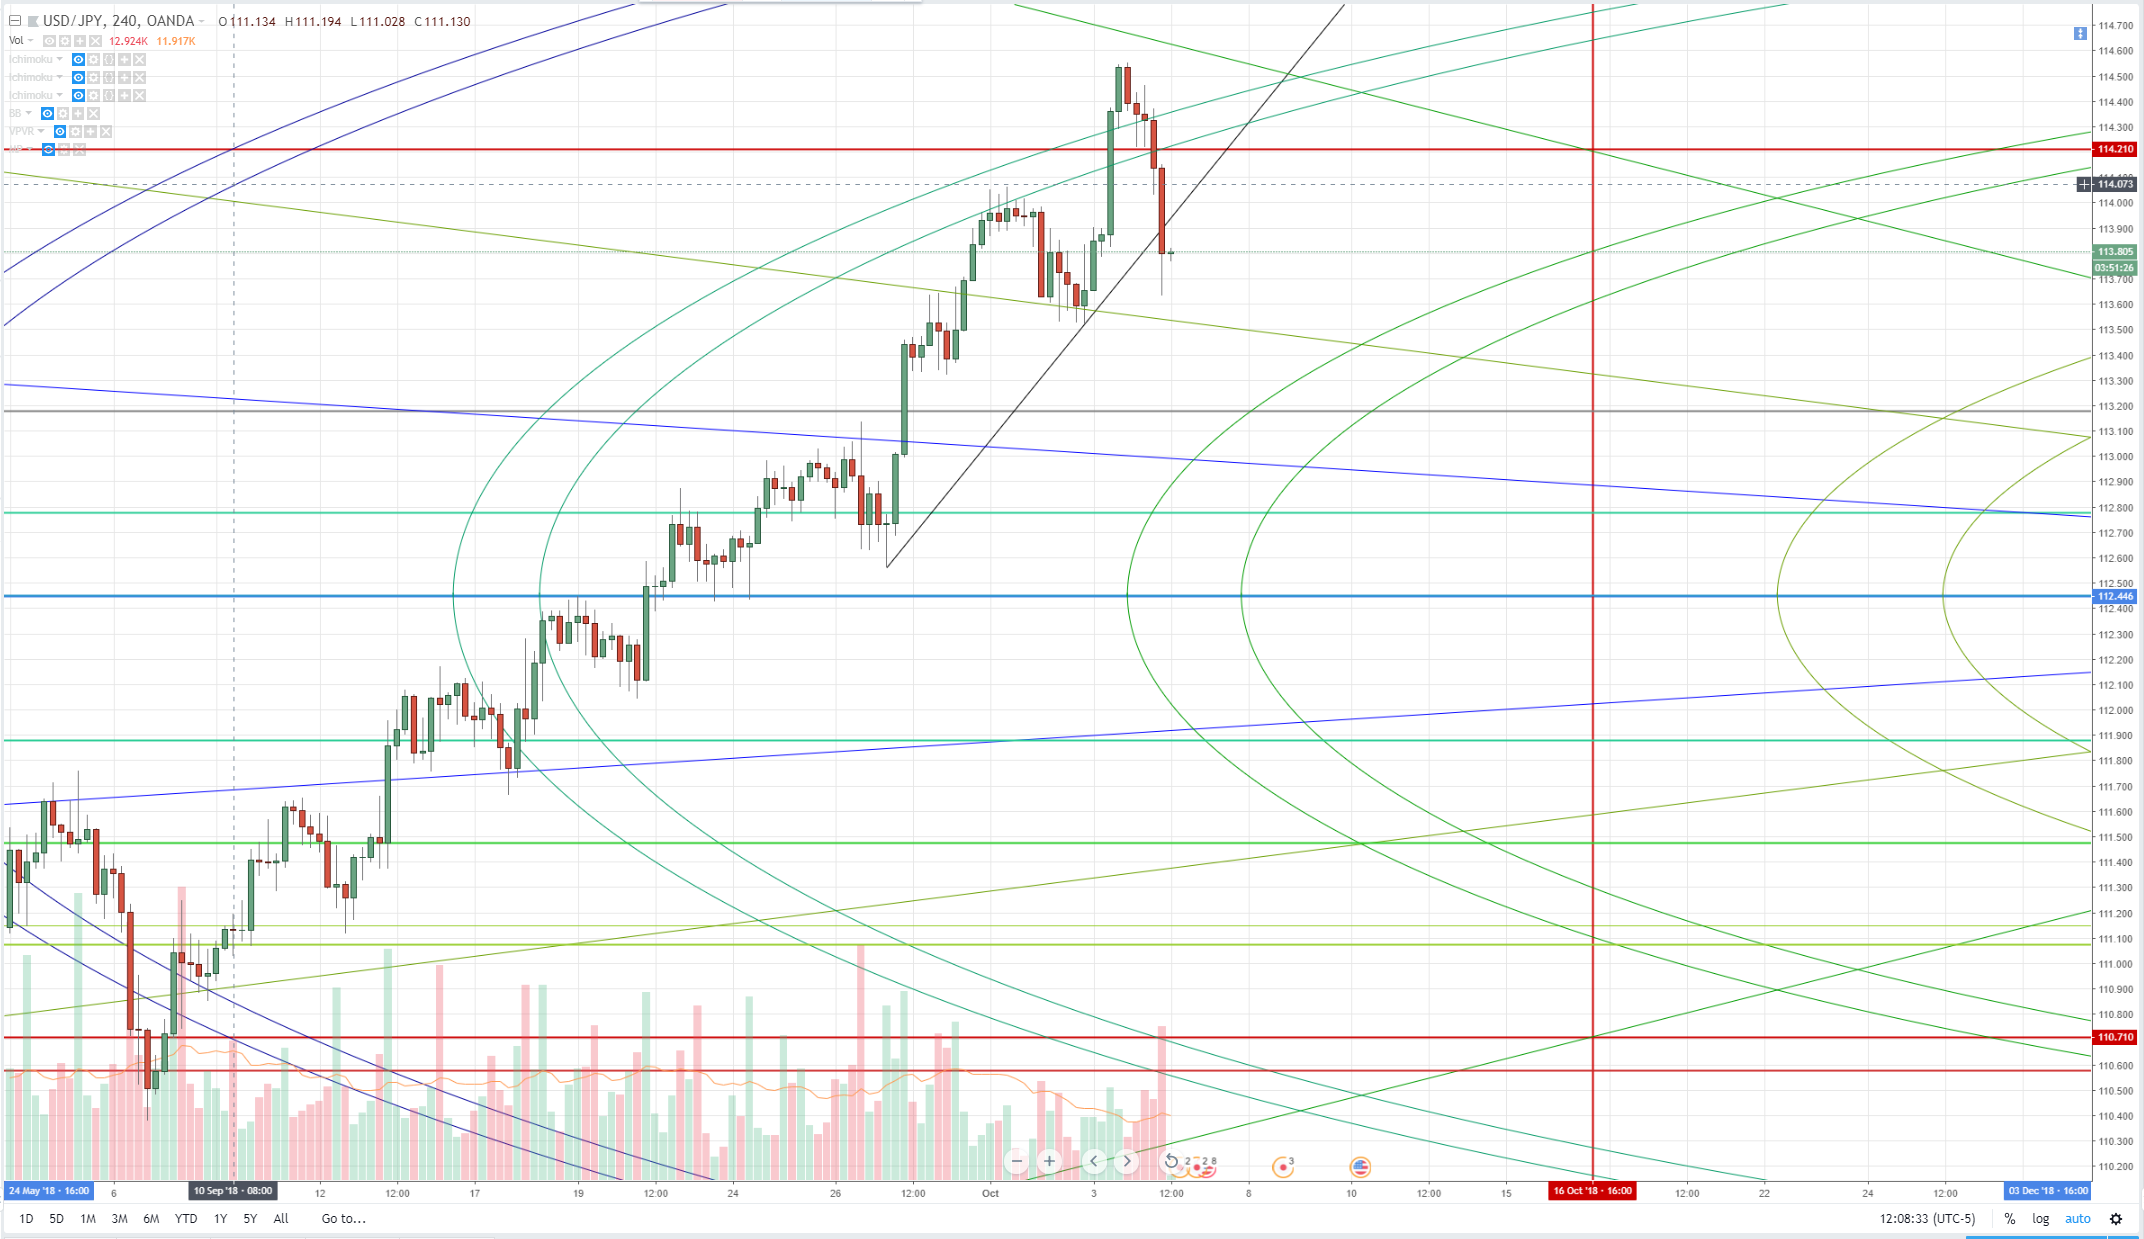 Above: USD/JPY fall below key trend line.
After creating new yearly highs near the New York session close, the USDJPY FX pair sold off, with little support to prop up prices higher. The new yearly high was found at 114.55 before selling off and dropping lower to 113.63. Price broke a key trend line that connected two higher lows made on September 27th and October 2nd. The USDJPY FX pair has been facing a tougher time reaching these higher highs because of some significant resistance zones in the current 114 value area. Besides the psychological level of 114, there is an inner 6/8th pivot at 114.21, a key down trending 45-degree angle at 114.59 and a Gann arc. Analyzing the slope of this trend shows that this is the third increase in the angle and rise of this current bull move that started on August 20th.
If this is truly the start to a short-term corrective move in the USDJPY, then there are some existing trend lines that need to be broken. If they are broken, then we can assume a 50% retracement of the entire swing is very probable. The 50% range between the swing low of 110.38 and 114.55 is the 112.44 value area. This is a very confluence zone showing not only the 50% retracement for the current move but also the 0.786 Fibonacci level of the 113.17 to 109.77 swing. 112.44 is also the 4/8 middle harmonic level between the two major harmonics of 115.96 and 101.96. Given these strong confluence zones, it is reasonable to speculate that it would hold as a strong support level.