- The Loonie advances benefited from a soft US dollar and high oil prices.
- Statistics Canada reported that consumer prices hit a 31-year high at 6.8%y/y.
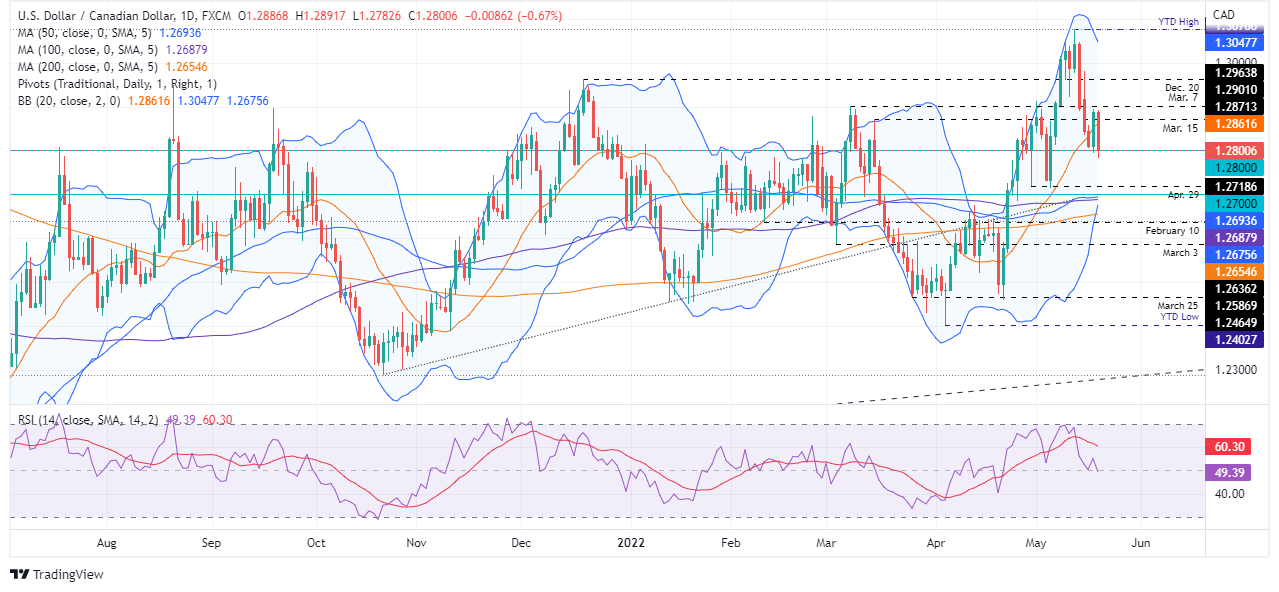
- USD/CAD Price Forecast: To reach 1.2700 once USD/CAD bears reclaim 1.2800.
The USD/CAD slides for the third day of the week and is trading back below the 1.2900 figure after two consecutive days of a busy Canadian calendar, which witnessed the release of inflationary figures, which showed that Consumer Prices rose. However, the market reacted the opposite way, sending the USD/CAD rallying above 1.2900, though Thursday’s is a different story. At 1.2801, the Loonie regained its strength, though the greenback is trading softer in the North American session.
Canadian inflation at 31-year highs
On Wednesday, Canadian data showed that inflation struck a 31-year high at a pace of 6.8% y/y, higher than the 6.7% foreseen. Analysts at TD Securities wrote in a note that the report might keep the Bank of Canada under pressure to bring policy to neutral. They added that although “The Bank has already acknowledged that additional 50bp hikes are likely, today’s report is unlikely to tip the scales towards a 75bp hike.”
“We continue to look for the Bank to hike by 50bps in June and July to bring the overnight rate to 2.00%, before switching to 25bp hikes from Sept-Jan,” TD Securities analysts noted.
Meanwhile, on Thursday, Statistics Canada reported that prices paid by producers, also known as PPI, came in line with expectations, but Raw Materials skyrocketed to 38.4% y/y, higher than the 31% estimations.
Along with a weaker US Dollar despite a risk-aversion environment, those factors are a headwind for the USD/CAD. Also, the rising US crude oil, with WTI’s gaining almost 1.50%, up at $110.79 per barrel, boosted the prospects of the Canadian dollar.
The US economic docket featured Initial Jobless Claims for the week ending on May 14, which grew by 218K, more than the 200K estimated. At the same time, the Philadelphia Fed Manufacturing Index increased to 2.6, much lower than the 17.6 estimated, following the New York Fed’s Empire State index drop, which shrank to 11.6, painting a dismal US ISM figure for June.
During the day, the Kansas City Fed President Esther George said that the “rough week in the equity markets” does not alter her support of 50-bps hikes to cool inflation. She added, “right now, inflation is too high, and we will need to make a series of rate adjustments to bring that down.”
On Wednesday, Philadelphia’s Fed President Patrick Harker stated that the Fed “doesn’t want to overdo it” and commented that the US might have a few quarters of negative growth, but that is not what he is forecasting.
USD/CAD Price Forecast: Technical outlook
The USD/CAD on Thursday tumbled below the 20-day moving average (DMA) at 1.2861, signaling that bears remain in control in the near term. Worth noting is the slope of the 50, 100, and 200-DMA, trapped in the 1.2693-54 area, almost horizontal, emphasizing the sideways price action of the major. Digging a little deep, the RSI is about to cross towards negative territory, meandering around 50, but with a downslope, opening the door for further losses.
That said, the USD/CAD first support would be 1.2800. Once cleared, the next demand zone would be the April 29 daily low at 1.2718, followed by the confluence of the 50 and 100-DMA at 1.26693 and 1.2688, respectively.
Information on these pages contains forward-looking statements that involve risks and uncertainties. Markets and instruments profiled on this page are for informational purposes only and should not in any way come across as a recommendation to buy or sell in these assets. You should do your own thorough research before making any investment decisions. FXStreet does not in any way guarantee that this information is free from mistakes, errors, or material misstatements. It also does not guarantee that this information is of a timely nature. Investing in Open Markets involves a great deal of risk, including the loss of all or a portion of your investment, as well as emotional distress. All risks, losses and costs associated with investing, including total loss of principal, are your responsibility. The views and opinions expressed in this article are those of the authors and do not necessarily reflect the official policy or position of FXStreet nor its advertisers. The author will not be held responsible for information that is found at the end of links posted on this page.
If not otherwise explicitly mentioned in the body of the article, at the time of writing, the author has no position in any stock mentioned in this article and no business relationship with any company mentioned. The author has not received compensation for writing this article, other than from FXStreet.
FXStreet and the author do not provide personalized recommendations. The author makes no representations as to the accuracy, completeness, or suitability of this information. FXStreet and the author will not be liable for any errors, omissions or any losses, injuries or damages arising from this information and its display or use. Errors and omissions excepted.
The author and FXStreet are not registered investment advisors and nothing in this article is intended to be investment advice.
Recommended content
Editors’ Picks
AUD/USD could extend the recovery to 0.6500 and above

The enhanced risk appetite and the weakening of the Greenback enabled AUD/USD to build on the promising start to the week and trade closer to the key barrier at 0.6500 the figure ahead of key inflation figures in Australia.
EUR/USD now refocuses on the 200-day SMA

EUR/USD extended its positive momentum and rose above the 1.0700 yardstick, driven by the intense PMI-led retracement in the US Dollar as well as a prevailing risk-friendly environment in the FX universe.
Gold struggles around $2,325 despite broad US Dollar’s weakness

Gold reversed its direction and rose to the $2,320 area, erasing a large portion of its daily losses in the process. The benchmark 10-year US Treasury bond yield stays in the red below 4.6% following the weak US PMI data and supports XAU/USD.
Bitcoin price makes run for previous cycle highs as Morgan Stanley pushes BTC ETF exposure

Bitcoin (BTC) price strength continues to grow, three days after the fourth halving. Optimism continues to abound in the market as Bitcoiners envision a reclamation of previous cycle highs.
US versus the Eurozone: Inflation divergence causes monetary desynchronization

Historically there is a very close correlation between changes in US Treasury yields and German Bund yields. This is relevant at the current juncture, considering that the recent hawkish twist in the tone of the Federal Reserve might continue to push US long-term interest rates higher and put upward pressure on bond yields in the Eurozone.