


Nasdaq 100, Dow, Dollar, EURUSD and GBPUSD Talking Points:
- The Nasdaq 100’s bearish break below 13,700 didn’t translate into a full-scale bear wave for the index – much less risk trends – with the Dow pushing a fresh record
- An inverse DXY Dollar head-and-shoulders seems to set the stage for a reversal, but without traction on rate forecasts or risk aversion, where will the spark arise?
- Keep close tabs on GBPUSD and other Sterling pairs as the BOE weighs policy

Risk Trends Produce Technical Breaks in Opposing Directions Among Major US Indices
There is an appetite for markets to move. Under normal conditions, market participants yearn for turbulence that channels us price action in a particular direction playing upon expectations that a they can enter and exit a position quickly and at favorable levels – though that is much more difficult than imagination often allows. Activity is one thing, commitment and momentum is another. The convergence of seasonal and structural liquidity conditions have pushed the financial system to exceptionally narrow trading ranges which makes many uncomfortable after a year of steady advance. It is therefore understandable that the market reads into technical breaks that represent relatively little clout. Yet, perhaps the best reminder of our conditions is comparing the recent technical breaks from the Dow Jones Industrial Average and Nasdaq 100. The latter made a key bearish break from three weeks of range Tuesday below 13,700. Meanwhile, the Dow advanced to a record high this past session. These are opposing ‘resolutions’ of congestion that are highly unusual (10-day correlation is the most extreme negative reading since June 2018). But rather than this signaling extreme conditions it suggests to me these are not committed breaks…yet.

Chart of Nasdaq 100 with 50 and 100-Day Mov Avg, 6-Day ATR and 16-Day Range (Daily)
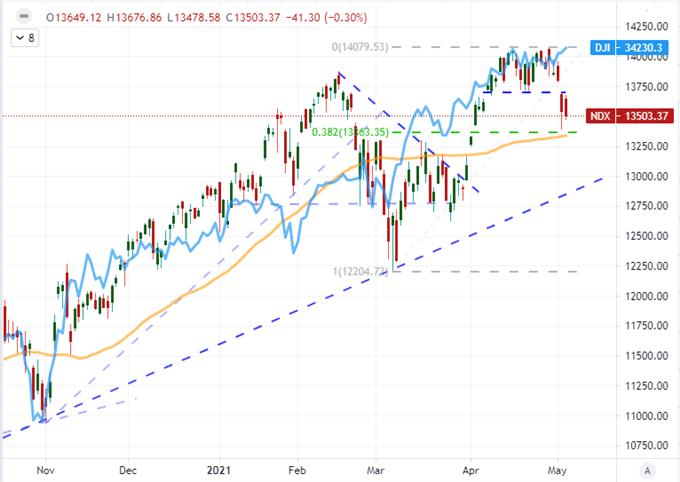
Chart Created on Tradingview Platform
When looking for a reliable charge to not only get markets moving but further build a head of momentum, fundamental motivation can often offer the most the predictable and potent tailwind. And yet, the event risk that has crossed the wires this week has fallen short of the task. Treasury Secretary Yellen’s remarks about the possible need to raise rates to head off an overheated economy (and later clarification to soften the blow) didn’t carry the Nasdaq 100 through its floor. Further, this past session offered up the ISM’s service sector activity report for April. While the indicator didn’t post as sharp a correction as the manufacturing figure on Monday, services did slip this past month and the sector accounts for more than three quarters of US output and employment. In today’s session, the critical US listings are light and there is the distraction of anticipating the NFPs on Friday.
S&P 500 Overlaid with ISM Service and Manufacturing Activity Reports (Monthly)
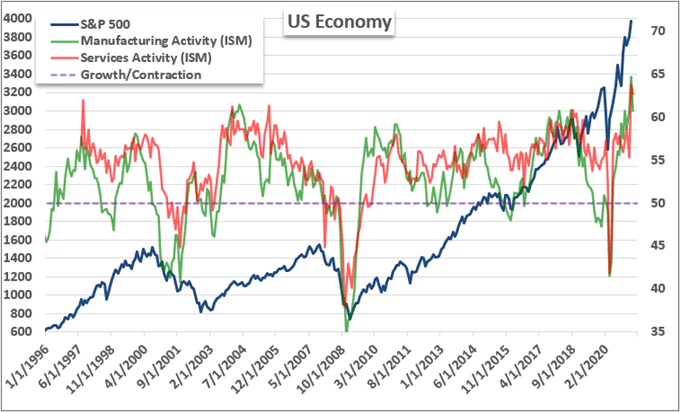
Chart Created by John Kicklighter with Data from ISM
The Dollar Is So Close to a Technical Trigger
More than the US indices and other risk-sensitive assets, I have found it more remarkable that the US Dollar has been thus far unable to metabolize recent event risk to resolve tight congestion. The DXY Index’s daily chart is quite distinct for technical levels. The trade-weighted measure of the Greenback is posing a rather clean inverse head-and-shoulders pattern with a neckline around 91.35. While the ISM report may act as a throttle to a bullish break unless fear drums up safe haven appetite, the lack of response to Yellen’s hawkish perspective is still remarkable. Another throttling factor may be that many Dollar based pairs aren’t staging the same clean picture that this measure offers.
Chart of the DXY Dollar Index with 20 and 100-Day Moving Averages (Daily)
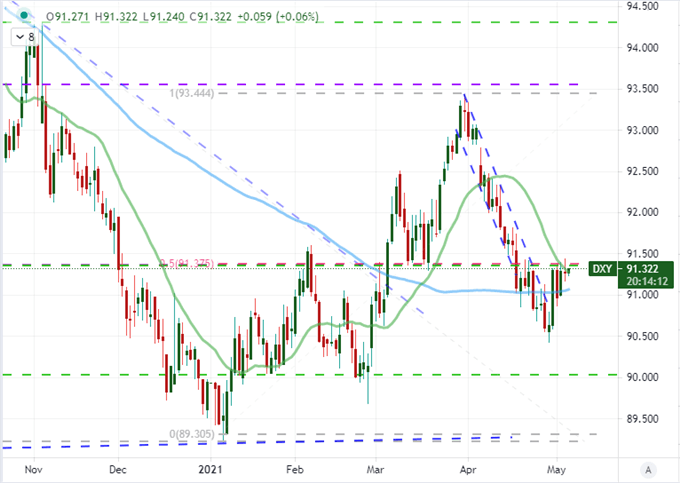
Chart Created on Tradingview Platform
Taking stock of the USD-based majors, many of them are set far enough back form their respective ranges that initial volatility would only push us to the bounds and further trend development would require some deeper conviction. Among the majors, EURUSD is interesting but not the exact mirror of the DXY that we often believe it to be. While there is something of threatening reversal pattern with this benchmark pair, it isn’t an H&S as I would define it. Instead, there is a counter-trend descending wedge. This more often registers as a bull pennant which is a continuation pattern. I’ll reserve judgement until there is a break.
Chart of EURUSD with 20 and 100-Period Moving Averages (2 Hour)
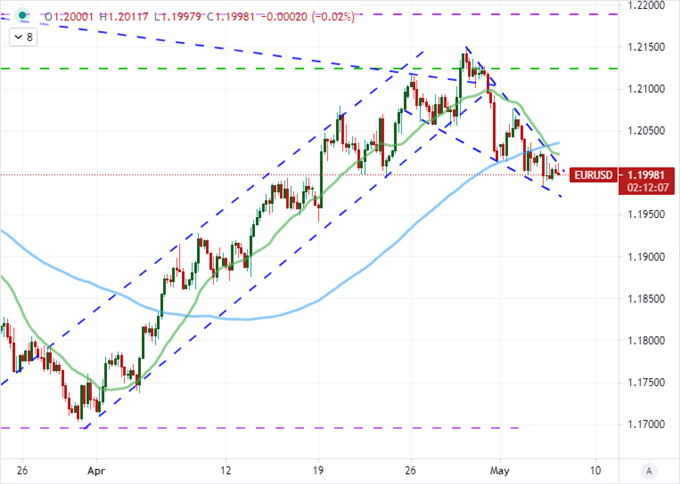
Chart Created on Tradingview Platform
The Top Scheduled Event Risk Ahead: Central Banks
Another Dollar pair that it is worth keeping a very close tab on for the upcoming session is Cable (GBPUSD). This pair is trading within the middle of a broader congestion pattern that is approximately a year in the making. The upside is well defined with a horizontal resistance at 1.4000 while support is a rising trendline support currently in the 1.3750/00 vicinity. As it happens, the past 50 days for this pair have been the most restrictive for developing trend that we have seen since July 2014. A break is overdue, but the same need for a catalyst is an important factor. For this cross, the motivation may come from the outside of the fence. Ahead, we have the Bank of England set to announce its monetary policy and release the updated forecasts from its quarterly report. If there are any surprises, GBPUSD wouldn’t be the only pair prone to significant movement.

Chart of GBPUSD with 20 and 100-Day Moving Averages, 50-Day Historical Range (Daily)
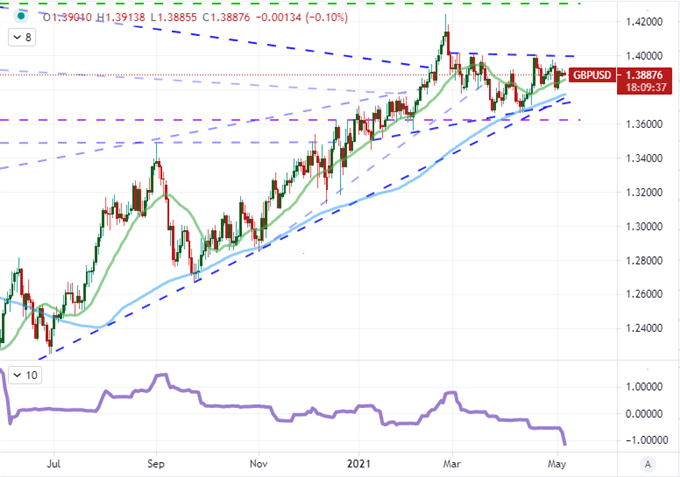
Chart Created on Tradingview Platform
In contrast to the Reserve Bank of Australia’s (RBA) hold on policy and language – with the commensurate lack of response from the Australian Dollar – earlier this week, speculation that the UK central bank may signal plans to taper have gained serious traction. If this group decides to take the first step down the normalization path, it would draw serious contrast to most counterparts and in particular the Dollar. Last week, the Federal Reserve made it clear they were punting the difficult decision to shape the market’s expectations for normalization. Playing to that contrast could result into a substantial movement similar to the USDCAD tumble after the Bank of Canada announced an outright taper in its asset purchases a few weeks ago.
Chart of Perceived Monetary Policy Standings of Major Central Banks
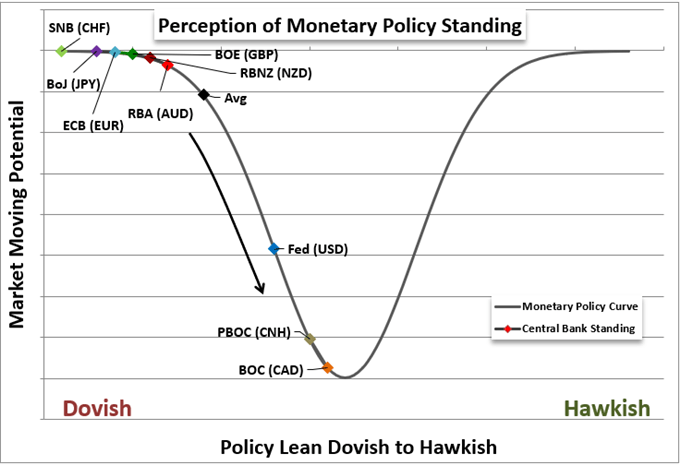
Created by John Kicklighter
Another central bank decision to keep on the radar is the Turkish monetary policy meeting. The TCMB is anticipated to hold its benchmark rate at 19 percent according to economist estimates, but you may recall that President Erdogan fired former governor Naci Agbal on March 22nd ostensibly due to the former finance ministers use of Western monetary policy strategy that pushed the nation’s key rate to onerous levels in order to fight inflation. The current top banker Sahap Kavcioglu has taken a view similar to the President’s that higher interest rates causes inflation. It seems only a matter of time before the rate cuts start, but how long will they wait to cool market fears? Have markets already accounts for rate cuts with USDTRY trading near 8.4000? Time will tell.
Chart of USDTRY with 20 and 100-Day Moving Averages (Daily)
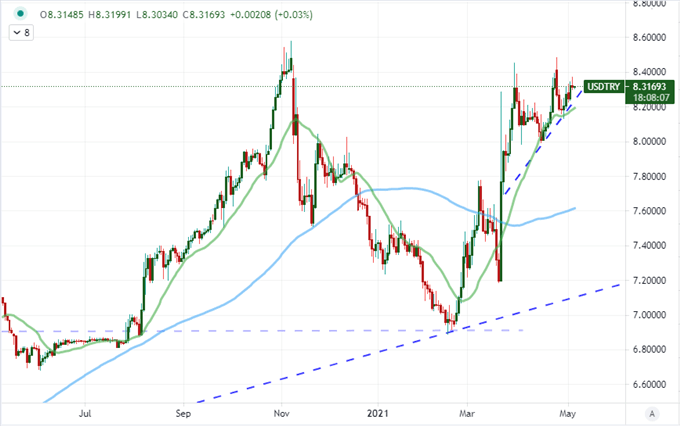
Chart Created on Tradingview Platform

.


