Stocks climb the wall of worry as trade headwinds fade into a light breeze
By Peter Kenny, founder of Strategic Board Solutions and owner of KennysCommentary.com
As I discussed on Yahoo Finance’s Market Movers last week, investors have once again shifted their collective attention away from relentless and schizophrenic geopolitical headlines. It even appears as though the fear of burgeoning trade wars and rising tariffs has had little impact on equity prices thus far in Q3. Since the beginning of July, investors have focused on the two principal drivers of equity market price discovery: earnings and economic data. In the process, equity markets have posted solid gains.
Q2 earnings continue to come in better than expected, by a wide margin. Though still relatively early on in this earnings season, of the S&P 500 (^GSPC) companies that have reported results, nearly 75% have beaten consensus earnings expectations. With Q2 S&P 500 EPS growth currently coming in at 20.5%, and top-line growth coming in at 9.2%, that rising tide in the form of Q2 performance is lifting valuations and as a result equity prices.
Equity investors are also continuing to benefit from healthy and seemingly sustainable economic expansion. Retail sales data for June and May (revised), released last week are a case in point. On a month-over-month (M/M) basis, both retail sales and retail sales less autos hit very constructive consensus: 0.5% and 0.4%, respectively. May’s results in both categories were revised significantly higher: from 0.8% to 1.3%, and from 0.9% to 1.4%.
The Federal Reserve’s monthly index of industrial production for June was also solid, coming in at 0.6% versus May’s revised negative 0.5% reading. Weekly jobless claims continue to astound. Last week’s figures (207K) were both well below consensus of 220K and lower than the previous week’s 215K.
Consumer confidence, business optimism, and nearly every measure of economic outlook all remain at multi-year highs.
For the S&P 500, 2800 has been resistance in recent months. Last week it closed above that technical level on Tuesday and managed to remain above it into the close on Friday, closing the week at 2,801.83. The stage is set for additional gains, with 2,800 acting as support if, as expected, earnings season moving forward continues to deliver significantly better than expected Q2 results.
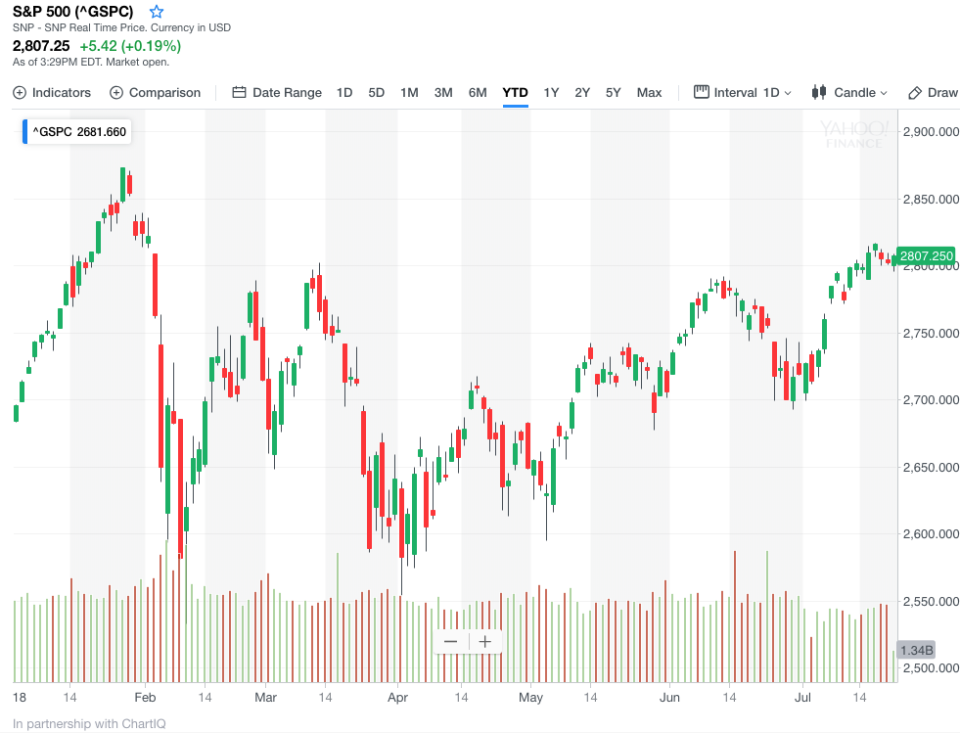
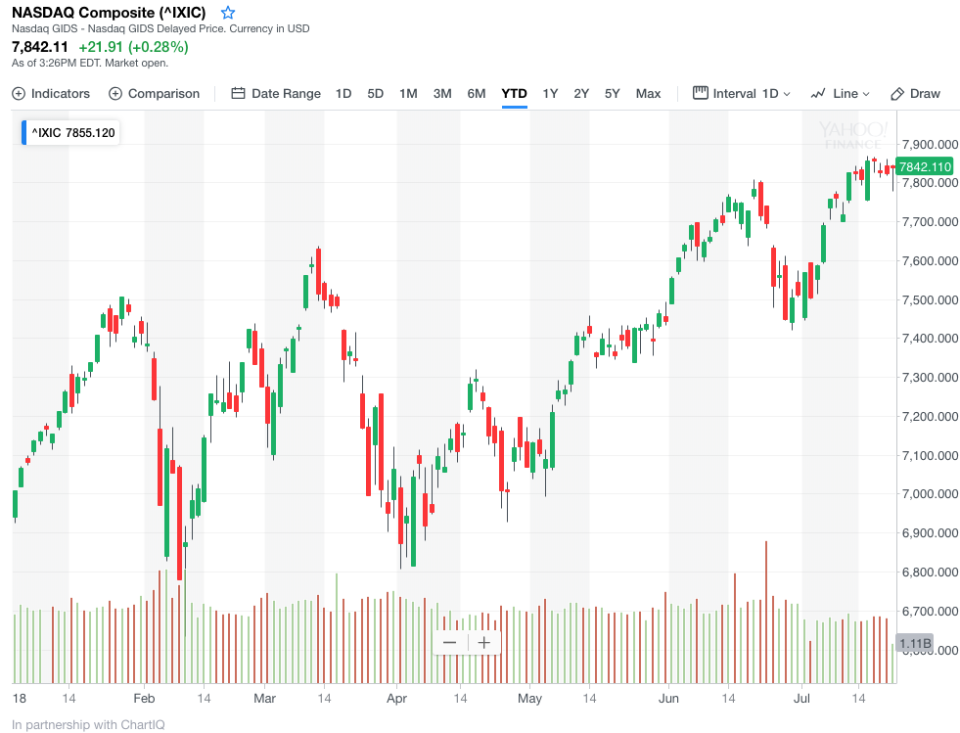
The positive framework for the S&P 500 laid out in the chart above differs little from the constructive technical framework outlined in the chart below for the Nasdaq Composite. In both cases, the indices closed last Friday, just off their all-time closing highs.
This week’s earnings calendar will be busy as we head into the heart of earnings season. Alphabet (GOOGL, GOOG) reports on Monday, and AT&T (T) reports on Tuesday. The earnings calendar and week get busier from there.
As far as the economic calendar is concerned, this week will provide several important releases, highlighted in green below. On Monday, existing home sales for June came in at 5.380 M, below the Econoday consensus of 5.450 M, and also below May’s 5.410 M (revised down from 5.430 M).
On Tuesday, PMI composite flash for July is released. Econoday consensus is 56.3 — up from June’s 56.0. New home sales and the EIA Petroleum Status Report are due on Wednesday. Thursday we receive Durable Goods Orders. Remember last month’s orders contracted on a M/M basis by 0.6%. Econoday consensus for June is a robust 3.2% gain. International trade and weekly jobless claims are due out on Thursday as well.
Without question, the Q2 GDP — Q/Q change — SAAR release is the most important economic data of the week ahead. It will be released on Friday at 8:30 am. Econoday consensus is 4.2%, up significantly from Q1’s 2.0%. The consensus is also expecting Real Consumer Spending Q/Q to lurch higher as well, from Q1’s 0.9% to 2.9%. Importantly, the GDP price index is expected to remain flat versus Q1’s 2.2%. In summary, the economy is expected to have grown nearly double the rate of inflation in Q2.
An accelerating GDP, contained in-channel inflation, solid economic data across the board, a re-engaged equity market rally, multi-decade low levels of joblessness and unemployment, historic low levels of unemployment among minorities, and a 26th consecutive quarter of EPS outperformance relative to the previous quarter-end estimates, all add up to a move higher for US equities. My quarter-end call for a gain of 5%-8% in the second half of 2018 remains.
Written by CFRA Chief Investment Strategist, Sam Stovall
The S&P 500 continues to close in on its January 26 bull-market high after suffering through a sharp and swift correction. A new high would confirm that this bull market remains alive and well and is only a little more than a month away from becoming the longest since WWII. Should a new high come soon, the “500” will have taken a bit more than five months to get back to breakeven, which was similar to the time required following the 14% correction (on a closing price basis) of 2015-16 and the near-bear market slump of 19.4% in 2011, but a month longer than the four-month average recovery time required for all prior 17 corrections since WWII. Encouragingly, history says, but does not guarantee, that the S&P 500 could advance nearly 10% beyond the prior high before slipping into another decline of 5% or more.
