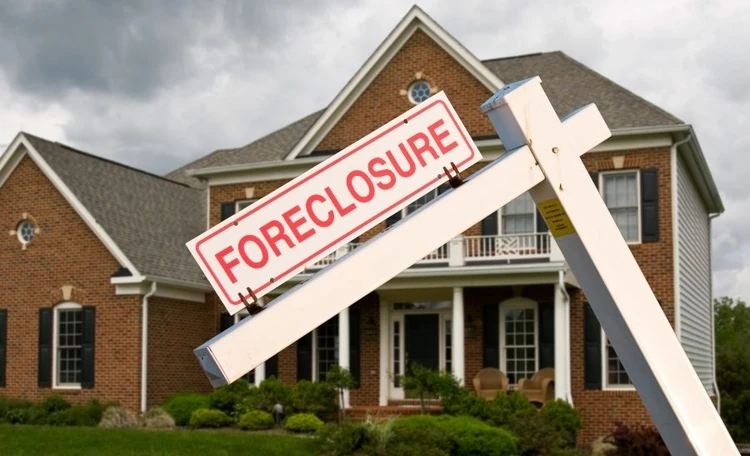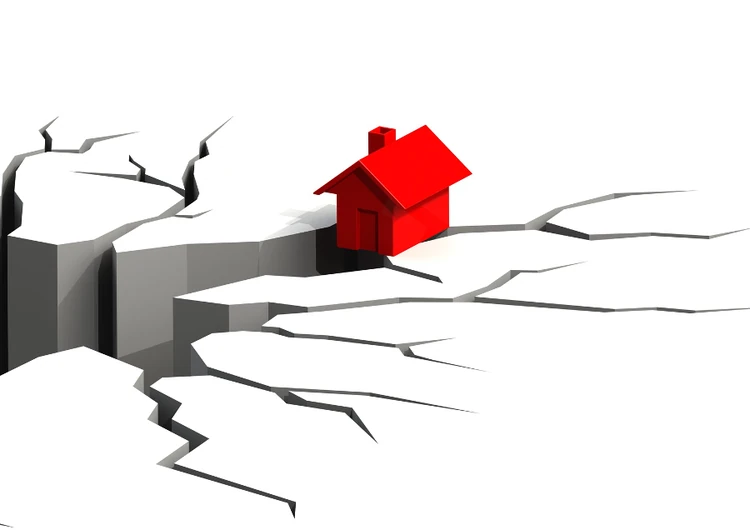
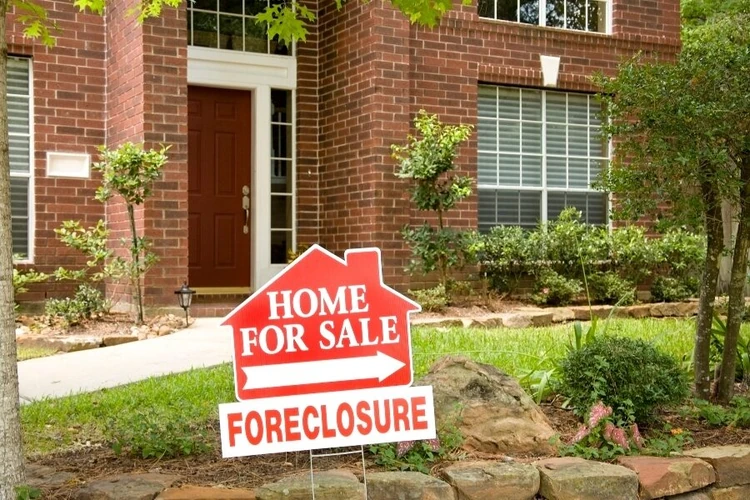
You may have seen headlines declaring that another housing crisis is right around the corner. What those stories probably won’t tell you is that foreclosures, which triggered the last crisis, are at an all-time low.
Real estate data provider ATTOM Data Solutions reports that foreclosure activity in 2019 fell 21 percent from the year before and was down 83 percent from the peak in 2010. It was at its lowest level last year since the company began tracking the data in 2005.
"The continued decline in distressed properties is one of many signs pointing to a much-improved housing market compared to the bad old days of the Great Recess
But that doesn’t mean the market is perfectly balanced, because it isn’t. Because of a shortage of housing, prices have risen faster than incomes, and affordability has become an issue in many markets. Teta notes that foreclosure starts increased in about a third of the nation's metro housing markets in 2019. Nationally, the number also ticked up a bit in December.
"While that's not a major worry, it's something that should be watched closely in 2020," he said.
Not very similar to the 2008 crisis
When some real estate articles warn of another housing crisis, they usually base that fear on rapidly rising home prices, pointing out that was the pattern during the housing bubble. But that’s pretty much where the similarity ends.
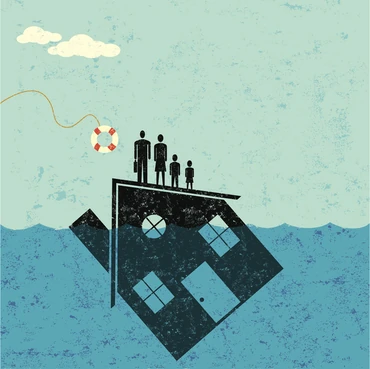
During the bubble days, builders were putting up new homes as fast as they could. Mortgage brokers would loan money to anyone whether they could afford the house or not. The broker didn’t care because they would sell the mortgage within days to a big bank that would securitize it and sell it on Wall Street. Everyone kicked the can down the street.
The whole house of cards began to tumble when the new homeowners, who couldn’t afford the homes they purchased, defaulted on their loans and triggered a wave of home foreclosures, causing property values to plunge.
Tougher loan standards
Today, mortgage underwriters are much stricter than during the bubble days. They don’t write a mortgage unless they are convinced the buyer will be able to afford it.
The reason for the recent rise in home prices is very different from the factors that drove home prices higher in the early 2000s. Since the housing crash, builders have produced new homes at about half the rate they did before the crash, leading to a housing shortage.
More buyers competing for fewer available homes has caused prices to go up. If builders were to start producing more entry-level homes, there’s no doubt that prices would moderate.
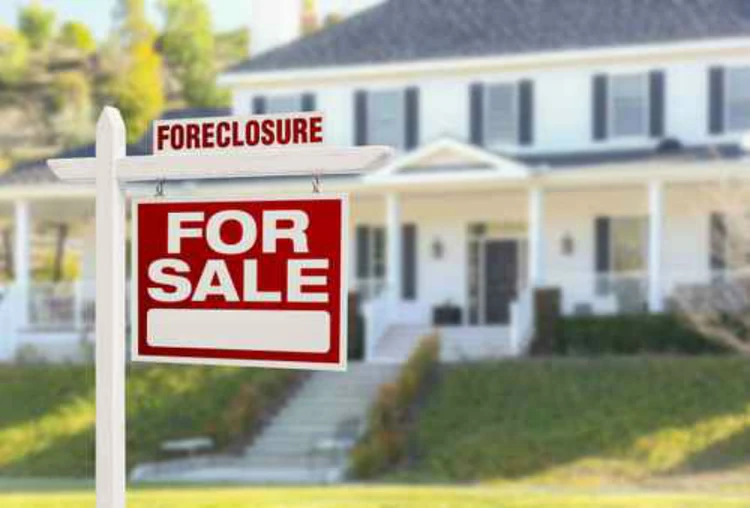
If foreclosures are the canary in the housing market’s coal mine, that bird continues to sing a happy tune. Not only are overall foreclosure filings 83 percent lower than their 2010 peak, but bank repossessions are also down 86 percent.