
 Yahoo Finance
 Is Olin Corporation’s (NYSE:OLN) Balance Sheet A Threat To Its Future?

Small and large cap stocks are widely popular for a variety of reasons, however, mid-cap companies such as Olin Corporation (NYSE:OLN), with a market cap of US$4.96b, often get neglected by retail investors. Surprisingly though, when accounted for risk, mid-caps have delivered better returns compared to the two other categories of stocks. Let’s take a look at OLN’s debt concentration and assess their financial liquidity to get an idea of their ability to fund strategic acquisitions and grow through cyclical pressures. Note that this information is centred entirely on financial health and is a top-level understanding, so I encourage you to look further into OLN here.
See our latest analysis for Olin
How much cash does OLN generate through its operations?
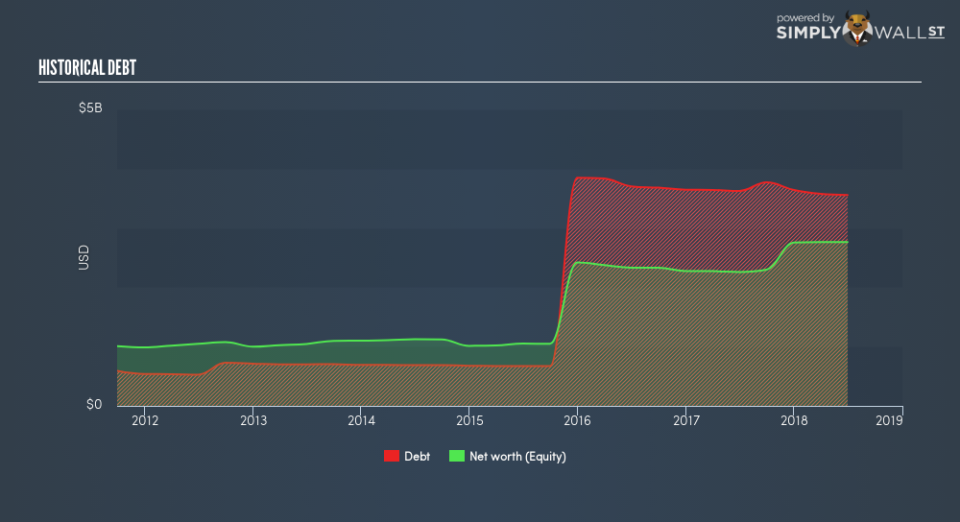
Over the past year, OLN has maintained its debt levels at around US$3.56b comprising of short- and long-term debt. At this stable level of debt, the current cash and short-term investment levels stands at US$152.60m , ready to deploy into the business. Moreover, OLN has generated US$685.70m in operating cash flow over the same time period, leading to an operating cash to total debt ratio of 19.27%, meaning that OLN’s debt is not appropriately covered by operating cash. This ratio can also be a sign of operational efficiency as an alternative to return on assets. In OLN’s case, it is able to generate 0.19x cash from its debt capital.
Does OLN’s liquid assets cover its short-term commitments?
At the current liabilities level of US$982.20m liabilities, it appears that the company has been able to meet these obligations given the level of current assets of US$1.76b, with a current ratio of 1.8x. For Chemicals companies, this ratio is within a sensible range since there is a bit of a cash buffer without leaving too much capital in a low-return environment.
Does OLN face the risk of succumbing to its debt-load?
OLN is a highly-leveraged company with debt exceeding equity by over 100%. This is not unusual for mid-caps as debt tends to be a cheaper and faster source of funding for some businesses. We can test if OLN’s debt levels are sustainable by measuring interest payments against earnings of a company. Ideally, earnings before interest and tax (EBIT) should cover net interest by at least three times. For OLN, the ratio of 2.36x suggests that interest is not strongly covered, which means that lenders may refuse to lend the company more money, as it is seen as too risky in terms of default.
Next Steps:
OLN’s cash flow coverage indicates it could improve its operating efficiency in order to meet demand for debt repayments should unforeseen events arise. Though, the company exhibits proper management of current assets and upcoming liabilities. I admit this is a fairly basic analysis for OLN’s financial health. Other important fundamentals need to be considered alongside. I recommend you continue to research Olin to get a better picture of the stock by looking at:
Future Outlook: What are well-informed industry analysts predicting for OLN’s future growth? Take a look at our free research report of analyst consensus for OLN’s outlook.
Valuation: What is OLN worth today? Is the stock undervalued, even when its growth outlook is factored into its intrinsic value? The intrinsic value infographic in our free research report helps visualize whether OLN is currently mispriced by the market.
Other High-Performing Stocks: Are there other stocks that provide better prospects with proven track records? Explore our free list of these great stocks here.
To help readers see past the short term volatility of the financial market, we aim to bring you a long-term focused research analysis purely driven by fundamental data. Note that our analysis does not factor in the latest price-sensitive company announcements.
The author is an independent contributor and at the time of publication had no position in the stocks mentioned. For errors that warrant correction please contact the editor at editorial-team@simplywallst.com.
