


Dow Jones, S&P 500, Technical Analysis, Retail Trader Positioning - Talking Points
- Retail traders remain net-short the Dow Jones and S&P 500
- However, this exposure is slightly fading ahead of Thanksgiving
- What are technical levels to watch for that may signal weakness?

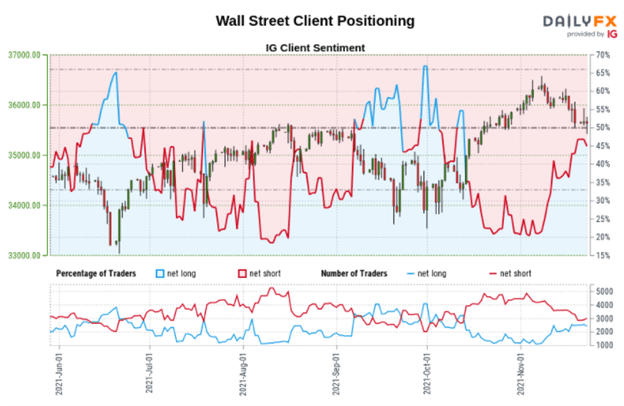
Looking at IG Client Sentiment (IGCS), retail traders remained net-short the major benchmark stock indices on Wall Street for most of this year. These include the Dow Jones and S&P 500. However, recent market volatility has been causing some of these bets to unwind ahead of the Thanksgiving Day holiday. IGCS tends to be a contrarian indicator. Will the recent dip on Wall Street translate into a meaningful shift in positioning, and what could this mean? Check out this week’s webinar recording where I discuss this in more detail above.
Dow Jones Sentiment Outlook - Bearish
The IGCS gauge implies that about 44% of retail investors are net-long the Dow Jones. Upside exposure has increased by 3.74% and 24.33% over a daily and weekly basis respectively. Since most traders remain net-short, this suggests prices may continue rising. However, recent shifts in positioning are offering a bearish-contrarian trading bias. Further upside exposure may hint at losses for the Dow Jones.
Technical Analysis
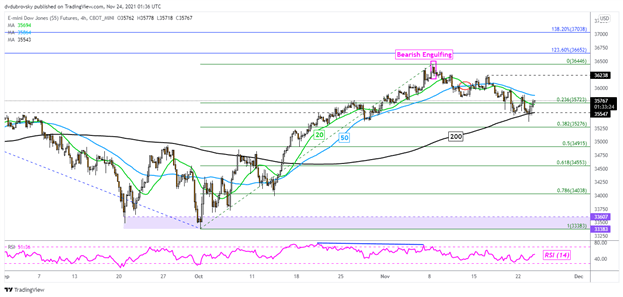
On the 4-hour chart, Dow Jones futures are eyeing the 200-period Simple Moving Average. This follows the near-term downtrend since early November. The line has pivoted prices higher recently, maintaining the broader upside focus. This is as the 20- and 50-period SMAs are offering a downside bias. Clearing the latter two may hint at further gains to come, placing the focus on the November 8th high at 36446. Otherwise, extending losses may see prices aim for October lows.
Dow Jones Futures 4-Hour Chart
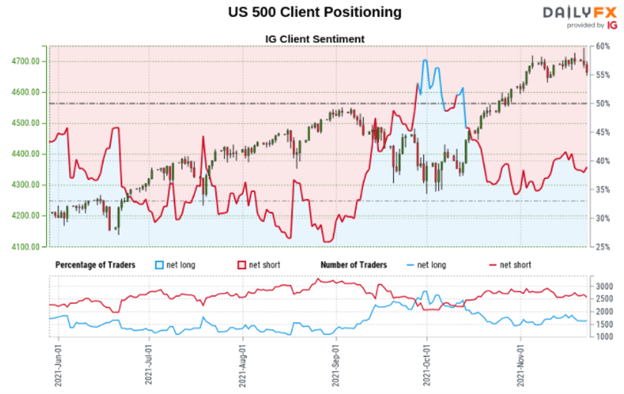
S&P 500 Sentiment Outlook – Mixed
The IGCS gauge shows that roughly 40% of retail traders are net-long the S&P 500. Since the majority of investors are still short, this suggests that the broader trend may remain tilted higher. However, upside exposure has climbed by 8.35% over a daily basis while falling by 6.62% over a weekly period. With that in mind, recent changes in positioning are offering a mixed trading bias.

Technical Analysis
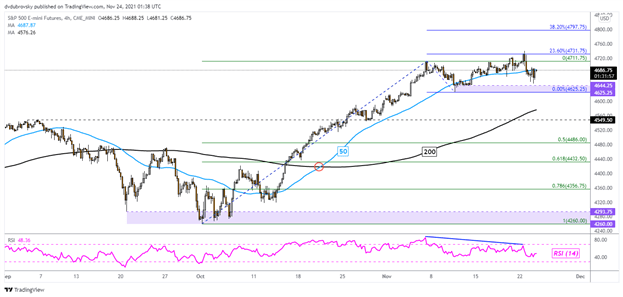
S&P 500 futures remain biased technically higher on the 4-hour chart. Prices are still far above the 200-period line as the index consolidates around the 20- and 50-period lines. Moreover, the key 4625 – 4644 support zone remains in play. Clearing the latter could be a signal that the next leg of the dominant uptrend will be lower. Such an outcome would place the focus on the 200-period SMA for follow-through. Clearing the latter exposes October lows. Otherwise, uptrend resumption places the focus on the 38.2% Fibonacci extension at 4797.
S&P 500 Futures 4-Hour Chart
*IG Client Sentiment Charts and Positioning Data Used from November 24th Report
--- Written by Daniel Dubrovsky, Strategist for DailyFX.com
To contact Daniel, use the comments section below or @ddubrovskyFX on Twitter


