What is Behind Huntington Ingalls Industries Inc’s (HII) Superior ROE?

Huntington Ingalls Industries Inc (NYSE:HII) outperformed the Aerospace and Defense industry on the basis of its ROE – producing a higher 36.39% relative to the peer average of 12.72% over the past 12 months. On the surface, this looks fantastic since we know that HII has made large profits from little equity capital; however, ROE doesn’t tell us if management have borrowed heavily to make this happen. We’ll take a closer look today at factors like financial leverage to determine whether HII’s ROE is actually sustainable. View our latest analysis for Huntington Ingalls Industries
What you must know about ROE
Return on Equity (ROE) weighs HII’s profit against the level of its shareholders’ equity. For example, if HII invests $1 in the form of equity, it will generate $0.36 in earnings from this. In most cases, a higher ROE is preferred; however, there are many other factors we must consider prior to making any investment decisions.
Return on Equity = Net Profit ÷ Shareholders Equity
ROE is assessed against cost of equity, which is measured using the Capital Asset Pricing Model (CAPM) – but let’s not dive into the details of that today. For now, let’s just look at the cost of equity number for HII, which is 9.31%. Since HII’s return covers its cost in excess of 27.08%, its use of equity capital is efficient and likely to be sustainable. Simply put, HII pays less for its capital than what it generates in return. ROE can be split up into three useful ratios: net profit margin, asset turnover, and financial leverage. This is called the Dupont Formula:
Dupont Formula
ROE = profit margin × asset turnover × financial leverage
ROE = (annual net profit ÷ sales) × (sales ÷ assets) × (assets ÷ shareholders’ equity)
ROE = annual net profit ÷ shareholders’ equity

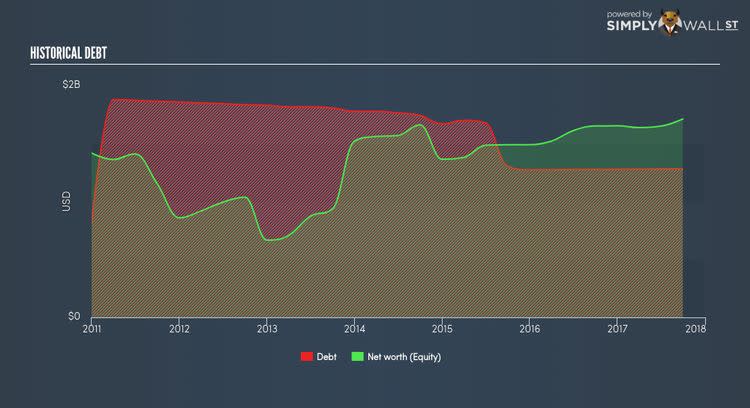
Basically, profit margin measures how much of revenue trickles down into earnings which illustrates how efficient HII is with its cost management. Asset turnover reveals how much revenue can be generated from HII’s asset base. The most interesting ratio, and reflective of sustainability of its ROE, is financial leverage. Since ROE can be inflated by excessive debt, we need to examine HII’s debt-to-equity level. Currently the debt-to-equity ratio stands at a reasonable 74.88%, which means its above-average ROE is driven by its ability to grow its profit without a significant debt burden.
What this means for you:
Are you a shareholder? HII’s above-industry ROE is encouraging, and is also in excess of its cost of equity. Since ROE is not inflated by excessive debt, it might be a good time to add more of HII to your portfolio if your personal research is confirming what the ROE is telling you. If you’re looking for new ideas for high-returning stocks, you should take a look at our free platform to see the list of stocks with Return on Equity over 20%.
Are you a potential investor? If you are considering investing in HII, looking at ROE on its own is not enough to make a well-informed decision. I recommend you do additional fundamental analysis by looking through our most recent infographic report on Huntington Ingalls Industries to help you make a more informed investment decision.
To help readers see pass the short term volatility of the financial market, we aim to bring you a long-term focused research analysis purely driven by fundamental data. Note that our analysis does not factor in the latest price sensitive company announcements.
The author is an independent contributor and at the time of publication had no position in the stocks mentioned.
