


Japanese Yen, USD/JPY, AUD/JPY, Inflation Woes, Tech Stocks Sour – Asia Pacific Market Open
- Japanese Yen and US Dollar gain, Australian and New Zealand Dollars drop
- Inflation woes dampened risk appetite, soft tech earnings sink Nasdaq 100
- Are USD/JPY and AUD/JPY facing turning points? APAC stocks vulnerable

Thursday’s Market Recap – Inflation Woes Continue Building
The anti-risk Japanese Yen and US Dollar were some of the best-performing major currencies on Thursday, capitalizing on a broad deterioration in market sentiment. The pessimistic tone began in Asia, spreading into European and North American markets. Stocks on Wall Street managed to recover from losses at the onset of the session. S&P 500 futures and the Nasdaq 100 closed higher as the Dow Jones turned red.
This meant a dismal day for the risk-sensitive Australian and New Zealand Dollars. Taking a look at commodities, growth-linked crude oil prices paused a persistent winning streak since late August. Still, WTI remains in an uptrend. Gold prices were little changed. Copper futures meanwhile tanked 3.52% in the worst single-day performance since June. The red metal tends to be a leading growth indicator.
Woes about rising inflation expectations likely played a role in financial markets. The 10-year Treasury breakeven rate touched its highest since 2005. The more positive breakeven rates are, the more inflation investors expect in the future. This is calculated by taking the difference between the yield of an inflation-protected bond with a nominal one of the same maturity.
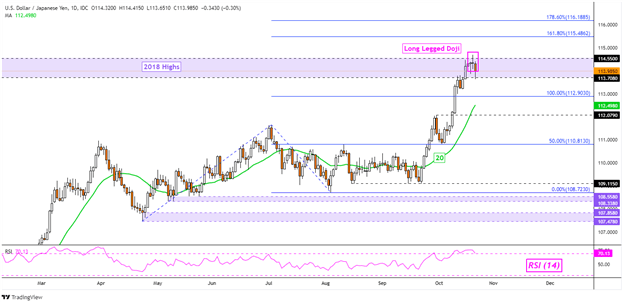
USD/JPY Technical Analysis
USD/JPY turned lower on Thursday after forming a long-legged Doji candlestick pattern on the previous day. The downside candle following the Doji could mean confirmation, opening the door to a near-term turn lower. This is as prices idle around the 113.70 – 114.55 resistance zone, made up of 2018 highs. Keep a close eye on the 20-day Simple Moving Average for key support below.

Friday’s Asia Pacific Trading Session – Watch Souring Sentiment in Tech Stocks
Asia-Pacific markets could be facing a pessimistic session after disappointing earnings from Snap Inc. and Intel depressed tech stocks in afterhours trade. This dominoed into other companies like Facebook and Google, which declined about 4.3% and 2.2% after their stocks closed for Thursday’s session. Nasdaq 100 futures declined over 0.5% after the close.
A lack of prominent economic event risk during Friday’s Asia Pacific session may place the focus for currencies on general market sentiment. Given the decline in Wall Street futures, this could set the stage for further gains in the US Dollar and Japanese Yen. This may come at the cost of the Australian and New Zealand Dollars.
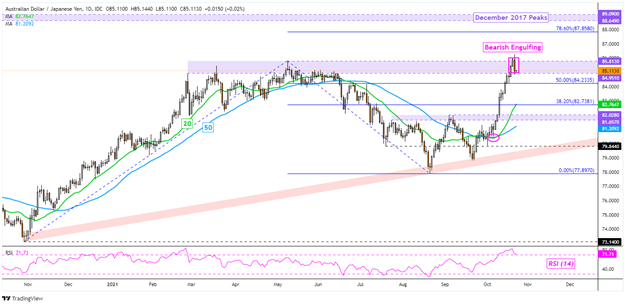
AUD/JPY Technical Analysis
AUD/JPY left behind a Bearish Engulfing candlestick pattern as the pair struggled to clear the 84.95 – 85.81 resistance zone. Investors ought to keep a close eye to see if the pair might achieve follow-through and confirmation. A further downside close could open the door to a near-term pullback. There remains considerable room to the downside before the 20-day SMA could come into play as key support.
| Change in | Longs | Shorts | OI |
| Daily | 11% | 9% | 10% |
| Weekly | 17% | 3% | 8% |
--- Written by Daniel Dubrovsky, Strategist for DailyFX.com
To contact Daniel, use the comments section below or @ddubrovskyFX on
Trade Smarter - Sign up for the DailyFX Newsletter
Receive timely and compelling market commentary from the DailyFX team


