Seismology in the air
Seismologists are usually interested in things that happen within the earth, but now and then a loud sound in the air can shake the ground enough for our seismographs to record it. Wednesday evening two weeks ago (March 7, 2018) such an event was recorded. Many news sources reported a flash of light and a boom being heard along the coast of Washington. At first there was some confusion about what it was, but within a day the evidence was pretty strong that the excitement was generated by a meteor or bolide entering the atmosphere and exploding. Preliminary analysis of seismic data allowed for a rough location and time for the event as reported by KING-TV interviewing a PNSN staff seismologist.
This was not the first time we have recorded and located a bolide. In early January, 2013 a flash in the sky and a thump on the ground near Spokane, WA was studied. Back in June 2004 a boom was heard in the Puget Sound area north of Seattle that we were able to get a rough location for. The current event took place off our coast but seemed stronger than either of the previous ones.
With some additional time and without the pressure of the TV news cycle we have looked into the data in more detail and have had interchanges of information with other organizations. In particular, Marc Fries of NASA and Paul Earle of the U.S.. Geological Survey have provided interesting observations and analyses. Before discussing their work I show here the seismograms from seismic stations along the coast of Washington that have seismic "arrivals" consistent with an explosion high in the air some distance off our coast. On the following seismograms we have marked the "arrivals" we think are associated with acoustic air waves from the explosion.
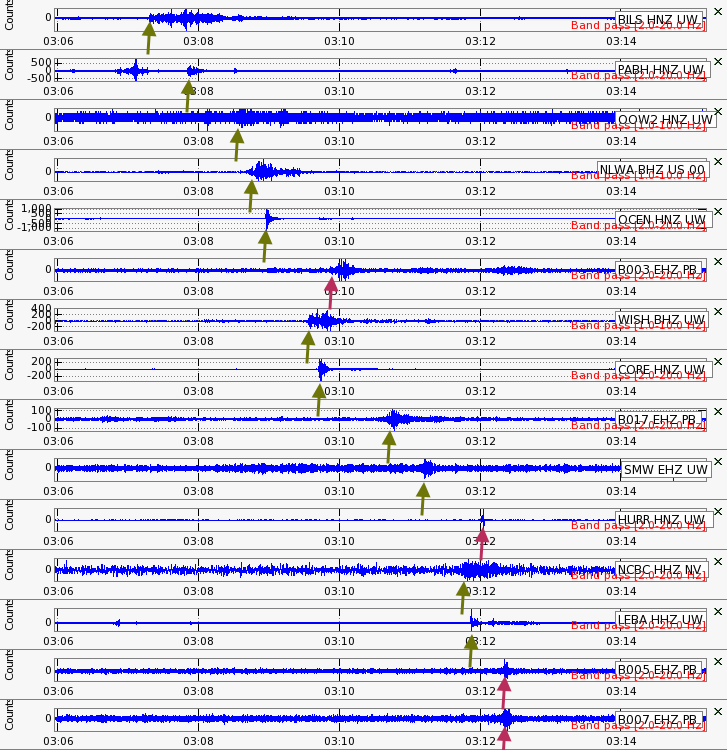
These seismograms are ordered by increasing distance from the event's source location. Our location was determined using the arrivals marked by the green arrows and an earthquake location program with a halfspace velocity of 0.310 km/sec (average speed of sound in cold air). The coordinates for this location are:
Date-time: 2018/03/08 03:05:58 GMT (2018/03/07 7:05:58 pm PST)
Epicenter: 47.47N -124.93W
Height: ~30.0 km
Number of stations used: 12
Time and distance errors: 4.4 seconds. 5.5 km
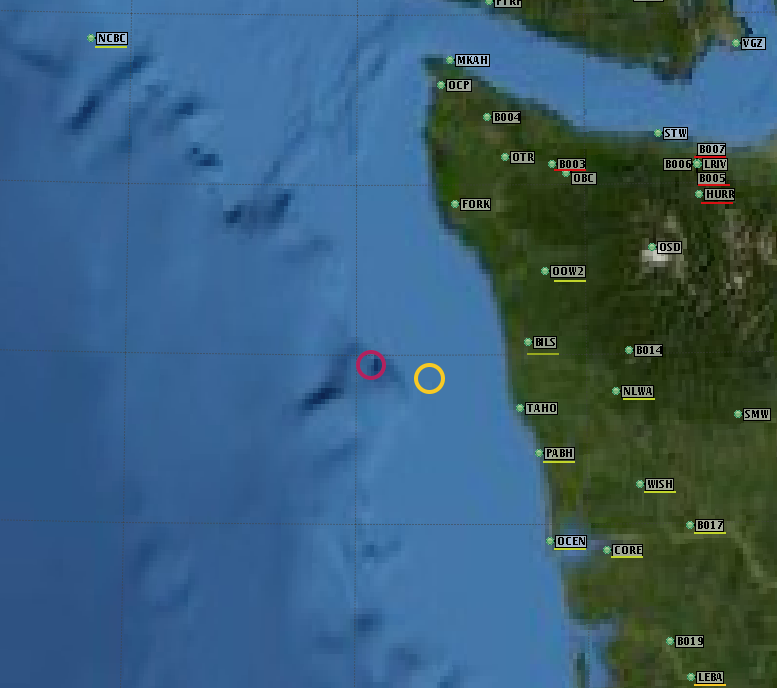
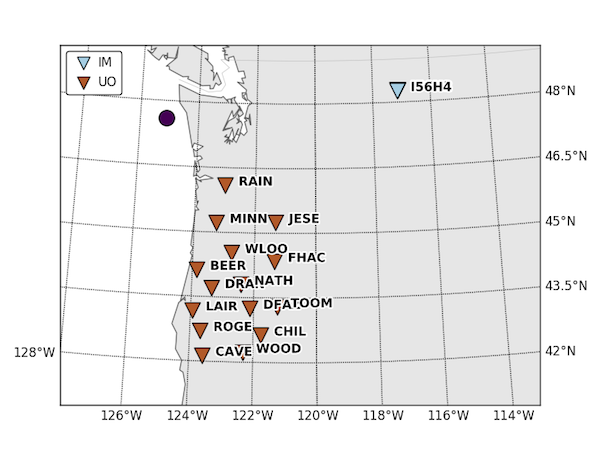
However, these formal error estimates are a minimum. Problems with using a simple halfspace model do not take into account the fairly large acoustic velocity variations over the travel path based on temperature nor the effect of wind. It is beyond the current effort to try and take these effects into account quantitatively. As evidence of a problem with the velocity model in air we are using is the fact that several, what appear to be good arrivals, are obviously quite late (red arrows on above figure). Here is a map of the area showing our location (red circle) and stations of the PNSN used to determine the location (green underlines) and those that don't fit (red underlines).
Note that the arrivals that don't fit are all to the northeast indicating that there is something different about this direction. Looking at the chart shown below for wind and temperature taken from a sounding at Forks, WA three hours earlier shows a very strong wind from the south-southwest over the lower 10-15 km of the atmosphere and a fairly uniform decrease in temperature down to -50 C at 12 km and then maybe a slight warm up above that. 
The combination of these factors SHOULD make the arrivals to the northeast somewhat early, not late. There must be something we are not taking into effect and thus our location may be significantly in error larger than the formal errors.
Also, note on our map the one station to the northeast (NCBC). This is an ocean bottom station that is part of the Canadian Neptune Cabled Ocean Array. It is located 400 meters below the surface but still seems to have an arrival that is possibly from the bolide (consistent arrival time with our location). Other stations in this network and the US based Ocean Observatory Initiative array, all at greater depths, don't seem to have arrivals that are consistent with this explosion unless there are very unusual and fast travel paths to them. We are not convinced that the arrivals at NCBC are due to the explosion but the timing is consistent with it.
There is other data which are consistent with our interpretation but doesn't have the resolution to improve or additionally constrain our location. Paul Earl of the USGS National Earthquake Information Center reminded us that our stations in southern Oregon actually have air pressure sensors as part of their routine data stream. He kindly provided us a plot of barograms (time series of air pressure) versus distance from our location shown in the following figures.
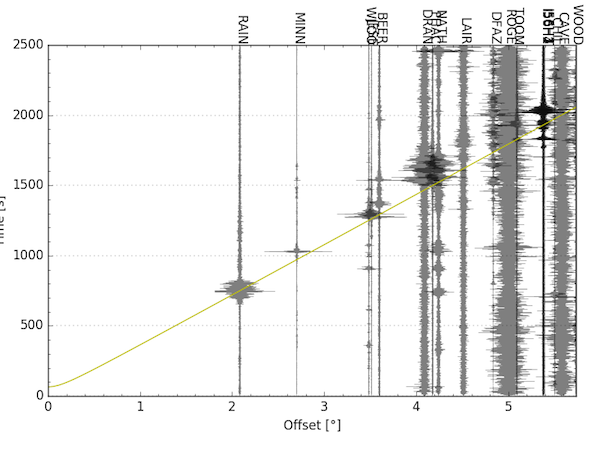
The very obvious arrivals on the barogram plot (time increases bottom to top and distance from the source in degrees is left to right) seem to line up pretty well with the yellow line which tracks arrivals traveling at 0.31 km/sec. Note that the one station located to the northeast (I56H4 and near the right side) has two arrivals, one that seems too early and one that seems too late. Having more than one such arrival at a station is not uncommon for these sorts of acoustic airwaves since there are a number of different paths that sound can take through the atmosphere besides echos from bouncing off nearby topography.
Finally, we can report some very different sort of data and perhaps ground truth. Marc Fries, a meteorite expert from NASA used weather radar images of the debris as it fell to earth after the explosion and determined not only the location but the total mass of material involved (~642 kg). I have plotted his location where the meteorite fall is distributed as the yellow circle on the map near the top of this post. Its center is about 16 km east-southeast of our location for the explosion. If both of these locations are correct it suggests a trajectory from the west-northwest at an angle of about 45 degrees. Of course our location is probably in error of at least 5 km and thus we don't put much weight in this interpretation.
Additional analysis of these data and other may be forthcoming in the future and will be reported as an addition to this post. However, we likely will return to studying things in the earth and leave cosmic events to others.
Help with this study was provided by Mouse Reusch (PNSN), Paul Earle (USGS), Marc Freis (NASA) and Cliff Mass (UW Atmospheric Sciences)