Is Eli Lilly and Company’s (NYSE:LLY) Balance Sheet Strong Enough To Weather A Storm?

Want to participate in a short research study? Help shape the future of investing tools and receive a $20 prize!
The size of Eli Lilly and Company (NYSE:LLY), a US$127b large-cap, often attracts investors seeking a reliable investment in the stock market. Big corporations are much sought after by risk-averse investors who find diversified revenue streams and strong capital returns attractive. But, its financial health remains the key to continued success. Let’s take a look at Eli Lilly’s leverage and assess its financial strength to get an idea of their ability to fund strategic acquisitions and grow through cyclical pressures. Remember this is a very top-level look that focuses exclusively on financial health, so I recommend a deeper analysis into LLY here.
View our latest analysis for Eli Lilly
Does LLY produce enough cash relative to debt?
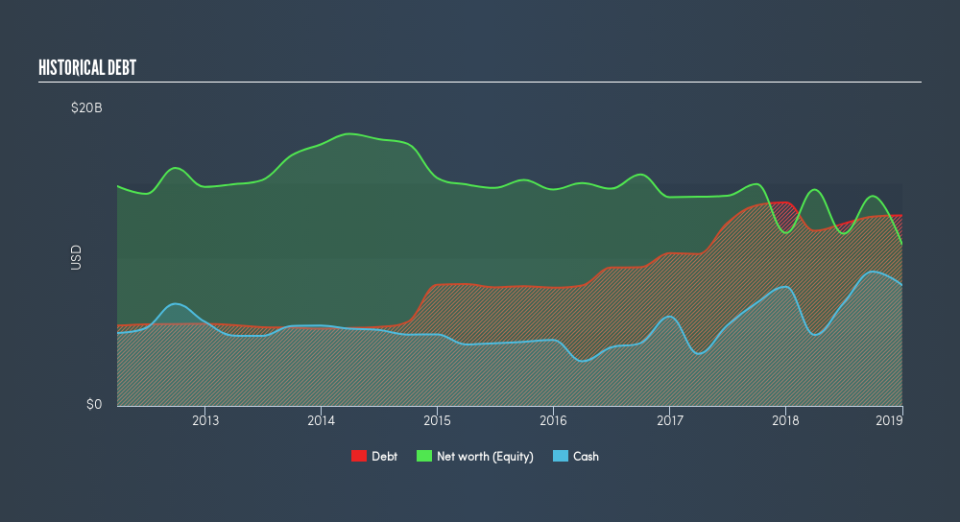
LLY’s debt levels have fallen from US$14b to US$13b over the last 12 months , which also accounts for long term debt. With this debt repayment, LLY currently has US$8.2b remaining in cash and short-term investments , ready to deploy into the business. Moreover, LLY has generated cash from operations of US$5.5b during the same period of time, leading to an operating cash to total debt ratio of 43%, meaning that LLY’s operating cash is sufficient to cover its debt. This ratio can also be interpreted as a measure of efficiency as an alternative to return on assets. In LLY’s case, it is able to generate 0.43x cash from its debt capital.
Can LLY meet its short-term obligations with the cash in hand?
At the current liabilities level of US$12b, it seems that the business has been able to meet these commitments with a current assets level of US$21b, leading to a 1.73x current account ratio. Generally, for Pharmaceuticals companies, this is a reasonable ratio since there’s a sufficient cash cushion without leaving too much capital idle or in low-earning investments.
Does LLY face the risk of succumbing to its debt-load?
With total debt exceeding equities, Eli Lilly is considered a highly levered company. This is not unusual for large-caps since debt tends to be less expensive than equity because interest payments are tax deductible. Since large-caps are seen as safer than their smaller constituents, they tend to enjoy lower cost of capital. No matter how high the company’s debt, if it can easily cover the interest payments, it’s considered to be efficient with its use of excess leverage. Ideally, earnings before interest and tax (EBIT) should cover net interest by at least three times. In LLY’s case, the ratio of 58.02x suggests that interest is comfortably covered. High interest coverage serves as an indication of the safety of a company, which highlights why many large organisations like LLY are considered a risk-averse investment.
Next Steps:
LLY’s high cash coverage means that, although its debt levels are high, the company is able to utilise its borrowings efficiently in order to generate cash flow. This may mean this is an optimal capital structure for the business, given that it is also meeting its short-term commitment. This is only a rough assessment of financial health, and I’m sure LLY has company-specific issues impacting its capital structure decisions. I suggest you continue to research Eli Lilly to get a more holistic view of the large-cap by looking at:
Future Outlook: What are well-informed industry analysts predicting for LLY’s future growth? Take a look at our free research report of analyst consensus for LLY’s outlook.
Valuation: What is LLY worth today? Is the stock undervalued, even when its growth outlook is factored into its intrinsic value? The intrinsic value infographic in our free research report helps visualize whether LLY is currently mispriced by the market.
Other High-Performing Stocks: Are there other stocks that provide better prospects with proven track records? Explore our free list of these great stocks here.
We aim to bring you long-term focused research analysis driven by fundamental data. Note that our analysis may not factor in the latest price-sensitive company announcements or qualitative material.
If you spot an error that warrants correction, please contact the editor at editorial-team@simplywallst.com. This article by Simply Wall St is general in nature. It does not constitute a recommendation to buy or sell any stock, and does not take account of your objectives, or your financial situation. Simply Wall St has no position in the stocks mentioned. Thank you for reading.
