 71 °F
71 °F

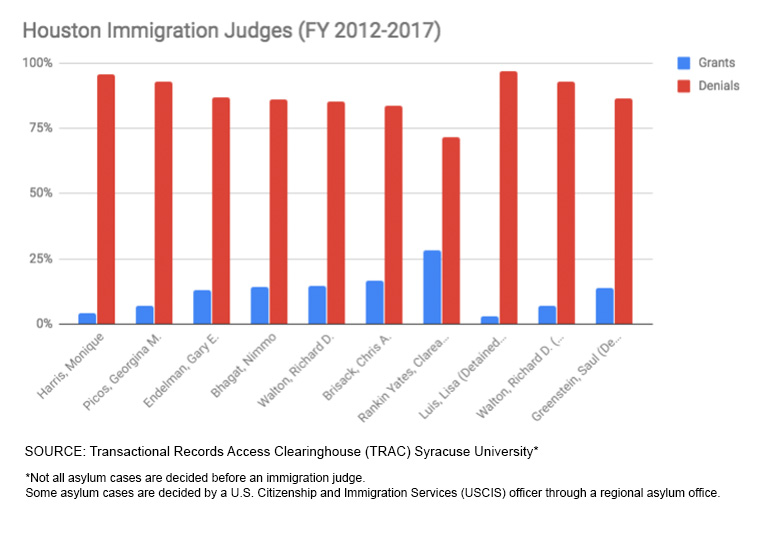
In Houston, one federal immigration court judge denied as many as 97 percent of asylum cases she heard between 2012 and 2017, according to data from Syracuse University. The average asylum denial rate in Houston was 87 percent.
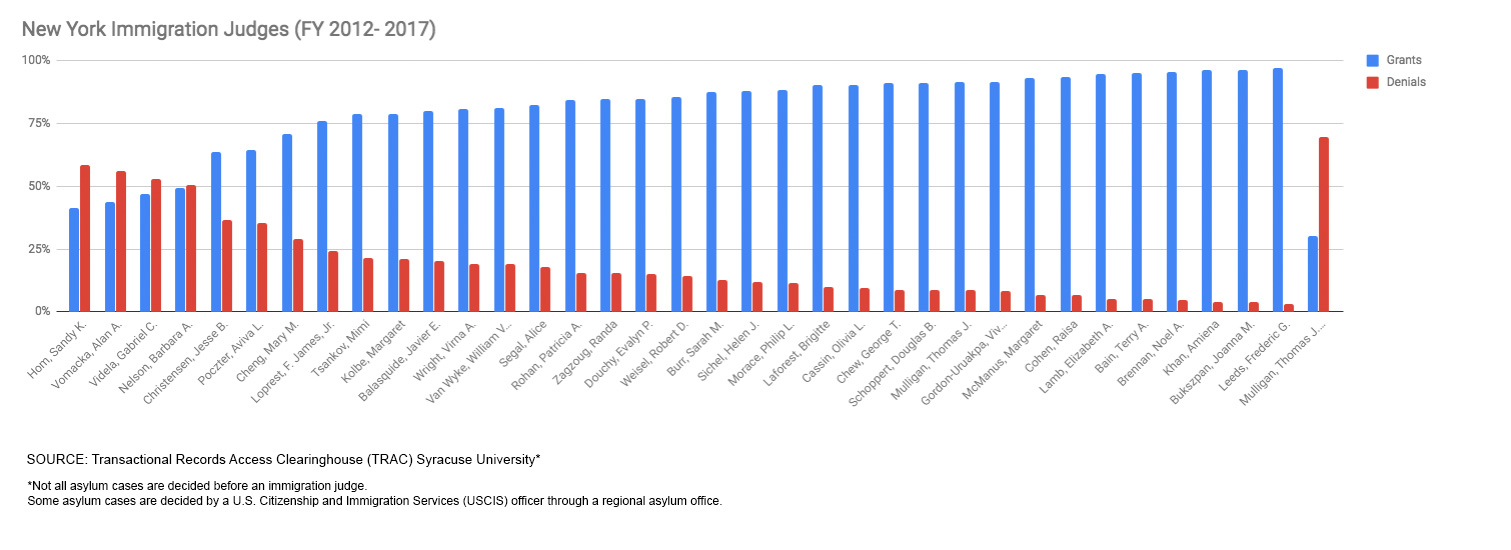
That wasn’t the case in other parts of the country. In New York City, immigration judges denied just 17 percent of asylum petitions during the same five year period.
Syracuse University's Transactional Records Access Clearinghouse (TRAC) compiled the data shown in the following infographics, which cover the period from Fiscal Year 2012 to Fiscal Year 2017.


In Houston courts, nine out of ten immigration judges had a rate of denials higher than 80 percent. Only one of them, Judge Clarease Rankin Yates, had a denial rate that was lower.
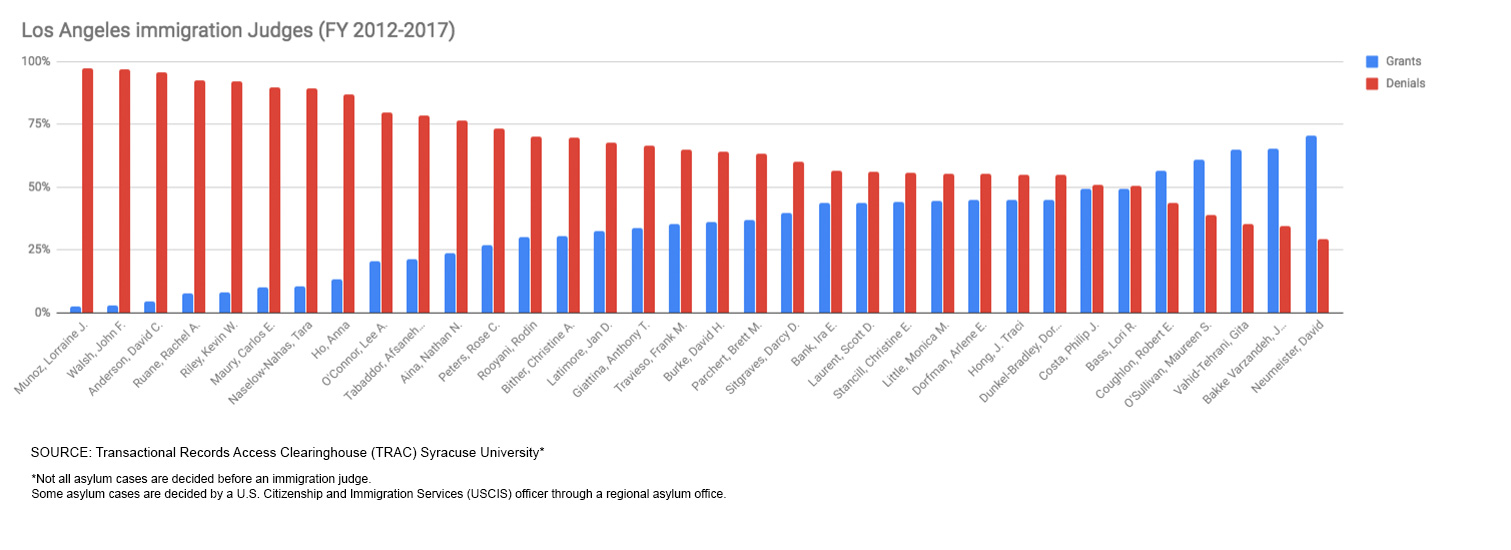
In comparison, all of the 36 New York judges had denial rates lower than 70 percent. Several had a rate lower than 10 percent. On the West Coast, 21 out of the 34 judges from the Los Angeles immigration court also had denial rates lower than 70 percent.
A number of factors may account for the differences.
Listen
Legal representation matters
One reason for differences in denial rates might have to do with lawyers: more immigrants in New York City lawyer up.
In Houston, having a lawyer can have a major impact on someone's chance of getting asylum, according to Andrea Guttin, Legal Director for the Houston Immigration Legal Services Collaborative.
“The single most important factor in removal proceedings is having an attorney,” said Guttin.
Guttin is working with lawyers to improve representation in Houston's immigration courts through a new program called Deportation Defense Houston.
In Texas, less than 30 percent of detained immigrants had legal representation from October 2000 to February 2018, according to TRAC data. (You can dive deeper into this by reading what was found by the reporting of WNYC’s Beth Fertig.)
Houston asylum-seekers are different
Another reason Houston's asylum denial rates are so high could be that Texas sees a larger share of Central Americans, many of whom are fleeing gang and domestic violence. Being a victim of personal violence never guaranteed someone asylum, but it can count even less now after Attorney General Jeff Sessions overruled a domestic abuse asylum case.
“The population that we get in this area, it's mostly seeking asylum because of the crime happening in the countries,” said Tatiana Obando, a Houston-based attorney with Refugee and Immigrant Center for Education and Legal Services (RAICES).
“While it is very sad and we agree that this is a matter of life or death, sadly it's not asylum,” she said.

Liberals and Conservatives
Then there’s politics. Obando said she found that some judges are simply more liberal than others. One time in Houston she presented a case before a visiting judge from New York.
“I walked in and the judge just asked the attorney ‘Do you have concerns about this case?’ and they granted my case just like that,” said Obando, “Later on, I had a similar case... exactly the same circumstances with a judge in Houston who denied my case.”
Ruby Powers, another immigration attorney who works in Houston and is familiar with asylum cases, thinks the idiosyncrasy of the east and west coasts has something to do with it.
“I think that the West Coast and the East Coast are a lot more open minded and liberal in some respects and, so, the conservatism in the south, (and) in Texas, sort of permeates its way through the case law,” said Powers.
You can watch Powers talking about her experience with asylum cases in Houston here:
“The Ninth Circuit, which is where California is, is very immigrant friendly and, in general, easier to get asylum approved. And New York is more lenient than the Fifth Circuit (Houston) as well,” said Powers. “The culture, the case law, however you want to call it, in the Fifth Circuit is not very immigrant friendly.”

“Your appellate law, which controls decision-making, is also various. The Ninth Circuit (California) is notoriously liberal,” said William Zimmer, a now-retired judge who presided in a Houston immigration court from 1995 to 2012.
While Zimmer acknowledges the liberal-conservative differences, he said his biggest issue with courts is that they can be influenced by whoever is in the White House. Immigration judges are hired through the Justice Department and critics have long argued that leads to judges being picked because of partisan ties.
“If you're going to call it a court, make it independent from the executive agency,” he said.
Zimmer said the executive branch can also influence judges by setting “case completion goals” and other expectations that he thinks can erode due process. Zimmer proposes setting up an independent court system to ensure fair trials for the thousands of migrants that come to the U.S. seeking better lives.
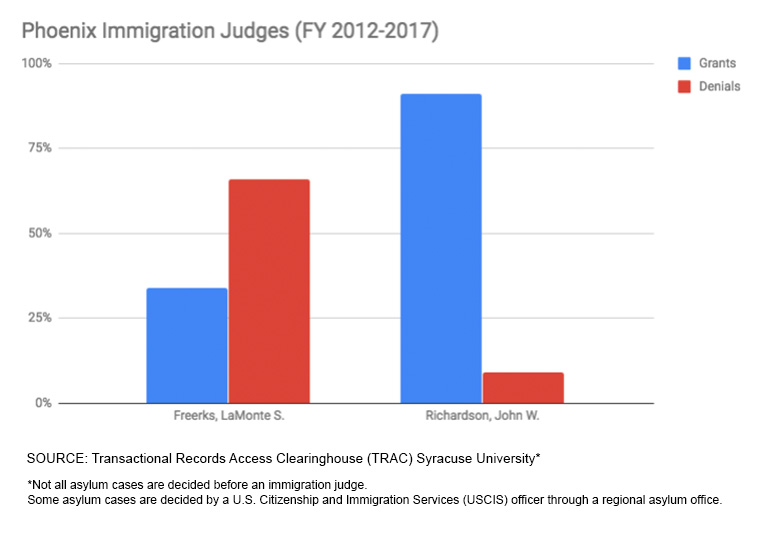
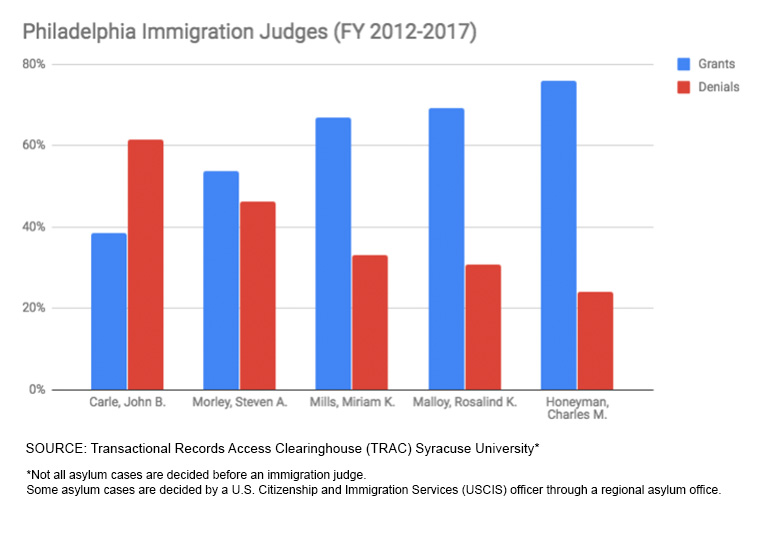
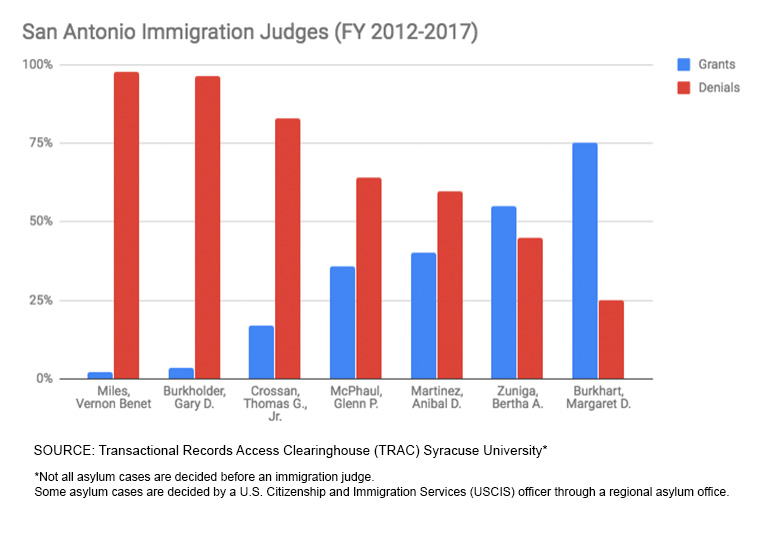
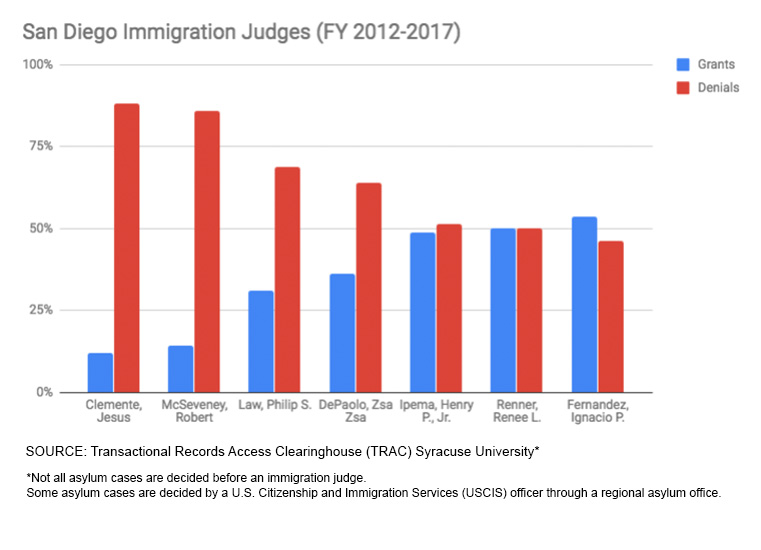
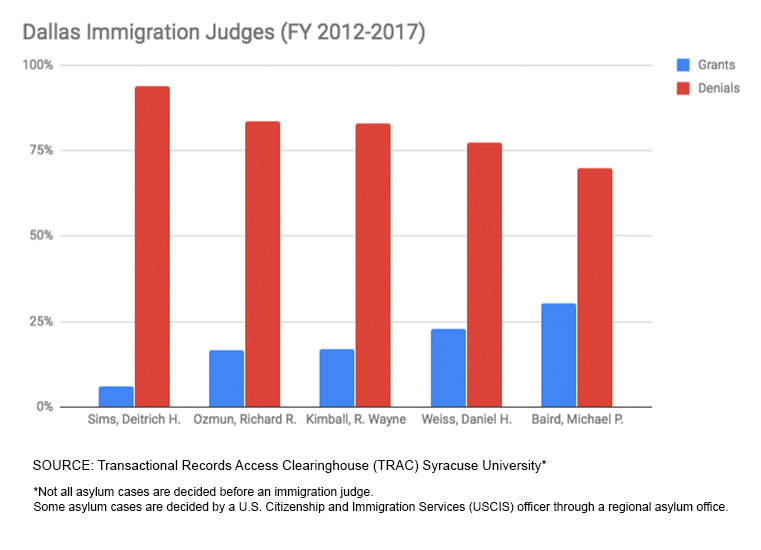
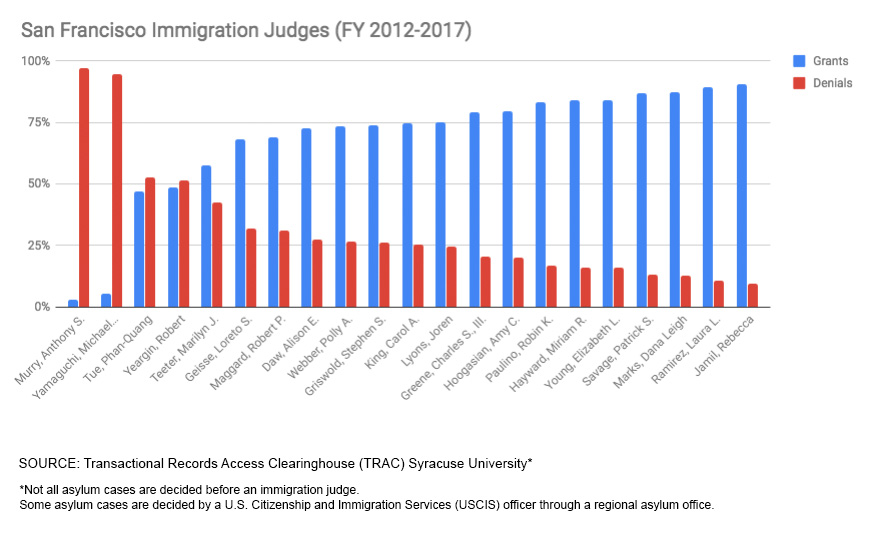
Infographics: Rates of granted and denied asylum cases
The following infographics show the percentage of asylum cases that were ultimately granted and denied in the immigration courts for the 10 most populated cities in the United States.
According to the U.S. Census Bureau, as of July 2017, those cities are: 1-New York (NY); 2-Los Angeles (CA); 3-Chicago (IL); 4-Houston (TX); 5-Phoenix (AZ); 6-Philadelphia (PA); 7-San Antonio (TX); 8-San Diego (CA); 9-Dallas (TX); and 10-San Jose (CA).
The San Francisco (CA) immigration court is responsible for asylum cases about individuals in San Jose (CA), which is the 10th most populated city.
Reporting for this story was done in collaboration with Beth Fertig at WNYC.
- Rates of granted and denied asylum cases. Source: Transactional Records Access Clearinghouse (TRAC) at Syracuse University
- Rates of granted and denied asylum cases. Source: Transactional Records Access Clearinghouse (TRAC) at Syracuse University
- Rates of granted and denied asylum cases. Source: Transactional Records Access Clearinghouse (TRAC) at Syracuse University
- Rates of granted and denied asylum cases. Source: Transactional Records Access Clearinghouse (TRAC) at Syracuse University
- Rates of granted and denied asylum cases. Source: Transactional Records Access Clearinghouse (TRAC) at Syracuse University
- Rates of granted and denied asylum cases. Source: Transactional Records Access Clearinghouse (TRAC) at Syracuse University
- Rates of granted and denied asylum cases. Source: Transactional Records Access Clearinghouse (TRAC) at Syracuse University
- Rates of granted and denied asylum cases. Source: Transactional Records Access Clearinghouse (TRAC) at Syracuse University
- Rates of granted and denied asylum cases. Source: Transactional Records Access Clearinghouse (TRAC) at Syracuse University
- Rates of granted and denied asylum cases. Source: Transactional Records Access Clearinghouse (TRAC) at Syracuse University