Approach Considerations
No laboratory data are diagnostic of constrictive pericarditis. However, as a result of the nearly universal findings of a chronically elevated right-sided atrial pressure and passive congestion of the liver, kidneys, and gastrointestinal (GI) tract, resultant abnormalities may be present (see Laboratory Studies below). Examples include elevations in both conjugated and unconjugated bilirubin levels, elevated levels of hepatocellular transaminases, and elevated serum creatinine.
A number of ancillary tests usually must be used to aide in diagnosis. These include chest radiography, computed tomography (CT), magnetic resonance imaging (MRI), echocardiography, and invasive hemodynamic measurements. Given the invasive nature of certain diagnostic procedures, inpatient care is often warranted in the workup. As mentioned, one of the most common issues arising from diagnostic testing is distinguishing restrictive cardiomyopathy from constriction.
Laboratory Studies
A complete blood count (CBC) may reveal evidence of dilutional anemia when congestive heart failure (CHF) is also present. Leukocytosis may be evident if an infectious, bacteriologic, or rheumatologic source is the etiology or if patients are receiving treatment with steroid therapy. Leukopenia may be present in patients in whom chemotherapeutic agents are administered for malignancy.
Dilution secondary to CHF may demonstrate hyponatremia or pseudohyponatremia. Contraction alkalosis (ie, hypochloremia with hypercarbia) may occur when diuretics are aggressively used. With renal insufficiency, short-term elevation of blood urea nitrogen (BUN) levels and long-term elevation of serum creatinine levels are observed.
On arterial blood gas measurement, metabolic acidosis (ie, low pH and low bicarbonate), with or without compensatory respiratory alkalosis (ie, decreased partial pressure of carbon dioxide), is frequently observed with right-sided CHF.
Passive hepatic congestion from cor pulmonale may cause elevated transaminase levels. Hypoalbuminemia is the hallmark of a protein-losing enteropathy (PLE) that results from increased central venous pressure in the portal system of patients with hepatomegaly and ascites (as well as of proteinuria that may approach the nephrotic range). When PLE is suspected, stool α1 -antitrypsinase levels should be measured.
If active or chronic inflammation is present, nonspecific markers, such as an elevated sedimentation rate (ESR) or a normocytic normochromic anemia, may be present. In postpericardiotomy syndrome, both the ESR and the C-reactive protein (CRP) level may be elevated.
The level of brain natriuretic peptide (BNP), a cardiac hormone released in response to increased ventricular wall stretch, is often mildly increased in constrictive pericarditis (usually below 150 ng/L). BNP levels are generally higher in restrictive cardiomyopathy (diagnostic if exceeding 650 ng/L) and may be useful in differentiating these disorders. [15, 16]
If an associated collagen vascular disorder is suggested, antinuclear antibody (ANA) or rheumatoid factor (RF) levels should be measured.
Results from a purified protein derivative (PPD) skin test should be positive in cases of tuberculous pericarditis (unless the patient is anergic).
Cytologic examination of the pericardial fluid, if present, helps diagnose a malignant cause (if such a cause is not otherwise apparent).
Chest Radiography
Radiographic findings are commonly unremarkable. However, certain classic findings, though not sensitive for the presence of constrictive pericarditis, are suggestive of the diagnosis when present within a compatible clinical context. For example, severe pericardial calcification is found in 20-30% of patients (see the image below); however, it is not specific and does not prove pericardial constriction. [17] The European Society of Cardiology recommends chest radiography (frontal and lateral) with adequate technical features in all patients with suspected constrictive pericarditis. [18]
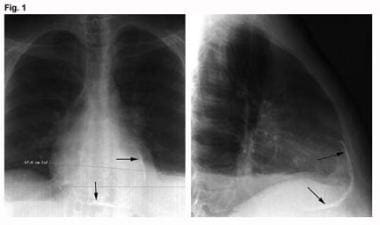 Constrictive Pericarditis. These images are anteroposterior and lateral chest radiographs from a patient with tuberculous constrictive pericarditis (arrows denote marked pericardial calcification).
If no significant pericardial effusion is present, the cardiac silhouette may appear normal. The superior vena cava, the azygos vein, or both may be dilated. Pleural effusions are common and are usually bilateral. Pulmonary edema is rare and might suggest other cardiac or lung disease
Echocardiography
Echocardiography has been used for many years to help diagnose constrictive pericarditis and, in particular, to differentiate it from restrictive and other cardiomyopathies. Unfortunately, no echocardiographic finding is pathognomonic for constriction. However, when all the echocardiographic data are taken together within a clinical context, the likelihood of constriction can usually be accurately assessed.
As a general principle, pericardial imaging by echocardiography is not sensitive and is not considered a reliable technique to visualize the pericardium. Admittedly, the pericardium can be echodense, but this is not always the case. Computed tomography (CT) scanning and magnetic resonance imaging (MRI) are considered the procedures of choice for imaging the pericardium.
Transesophageal echocardiography (TEE) is more reliable than transthoracic echocardiography (TTE) for helping to detect a thickened pericardium, especially if the pericardium is thick or very echogenic, but it is not nearly as accurate as CT scanning or MRI. [19] The European Society of Cardiology recommends TTE in all patients with suspected constrictive pericarditis. [18]
A study by Welch et al indicated that echocardiography can be used to differentiate constrictive pericarditis from restrictive myocardial disease and severe tricuspid regurgitation. The study compared echocardiograms in 130 patients with constrictive pericarditis with those of 36 patients with either of the other two conditions. The investigators determined that if ventricular septal shift was present with either a medial mitral annular e’ velocity of 9 cm/sec or greater or a hepatic vein expiratory diastolic reversal ratio of 0.79 or greater, constrictive pericarditis could be diagnosed with a sensitivity of 87% and a specificity of 91%. If all three factors coexisted, the diagnosis could be made with a specificity of 97%, but with a sensitivity of only 64%. [20]
Two-dimensional echocardiography
On two-dimensional echocardiography, systemic veins may be dilated. The echocardiogram may reveal diminished intraventricular volumes. Pericardial effusions are easily detected with this modality.
Interventricular septal motion may be paradoxic or the septum may have a flattened appearance as a sign of ventricular interdependence. The inspiratory increase in chamber size is larger in patients with constrictive pericarditis than in those with restrictive cardiomyopathy.
The posterior motion of the interventricular septum relative to the less compliant ventricular walls (which are encased by the pericardium) correlates with the auscultatory pericardial knock (which can be seen on M-mode and two-dimensional echocardiography as an early diastolic septal notch or “septal bounce”). [21] This septal bounce is considered a finding consistent with constrictive physiology, with sensitivity of 62% and specificity of 93%. [22]
Two-dimensional echocardiography can show evidence of right-sided pressure overload, such as atrial septal shifting to the left with inspiration. There also may be dilation of the inferior and superior venae cavae and hepatic veins, with diminished collapse with inspiration. These are nonspecific signs that can also occur in right-sided heart failure as a result of other causes.
Doppler echocardiography
Doppler echocardiography provides important hemodynamic information. A number of Doppler findings are sensitive for pericardial constriction when present, but as with many echocardiographic signs, their absence does not exclude constrictive hemodynamics. [23, 24]
Early rapid diastolic filling can be determined by interrogating forward flow at the mitral and tricuspid valve levels. The resulting waves are termed the E (for early filling) and A (for atrial filling) waves.
The transtricuspid velocities show an opposite pattern to the transmitral velocities. Across the tricuspid valve, velocities increase with inspiration and decrease with expiration, whereas across the mitral valve, velocities decrease with inspiration and increase with expiration. The shortened deceleration time from these peak velocities is felt to correspond to the dip-and-plateau hemodynamics seen with limited early diastolic flow.
The pulmonary vein Doppler inflow pattern also has respiratory variation; its diastolic inflow is greater than its systolic inflow, and this inequality may even reverse. During constriction, the pulmonary venous flow pattern demonstrates systolic and diastolic forward flow, with a marked decrease in diastolic flow on inspiration and an increase on expiration. This measurement may help determine if a pseudonormalized diastolic pattern is present on the mitral inflow tracing.
Pulsed-wave Doppler of the hepatic venous flow mimics right-sided atrial pressure curves. In constriction, there is often marked diastolic flow reversal that increases with expiration when compared with inspiration. However, in severe constriction or a mixed constrictive-restrictive picture, there may be hepatic diastolic flow reversal in inspiration as well as expiration. This contrasts to restrictive cardiomyopathy, in which hepatic flow reversal is more prominent in inspiration. [22]
Doppler ventricular inflow patterns can help distinguish constrictive from restrictive cardiac physiology, though the distinction may be technically challenging to make.
From a Doppler perspective, constriction limits ventricular filling and enhances ventricular interaction; conversely, restriction generally limits ventricular distensibility. Respiratory variation is usually greater in constriction than in restriction (probably because of the normal intraventricular septum), with changes usually exceeding 25%. With restriction, the E/A ratio frequently is greater than 2, the deceleration time is less than 150 ms, and the relaxation time is less than 60 ms. Unfortunately, when such Doppler findings are not present, the diagnostic reliability decreases. If a concomitant pericardial effusion is present, it may account for some respiratory variation. [17]
Tissue Doppler echocardiography (TDE) measures the actual endocardial and epicardial tissue velocities. Because myocardial relaxation itself is preserved in pure constrictive pericarditis, the early relaxation myocardial velocity (Ea, also known as Em) is normal, whereas it is abnormal with restriction (when intrinsic myocardial disease is present). For example, given that a normal Ea is higher than 10 cm/s, a near-normal (approximately 8 cm/s) Ea supports constriction, whereas a much lower Ea supports restriction. [25]
The newer method of speckle tracking of B-mode images measures cardiac longitudinal and circumferential deformation. Patients with constrictive pericarditis were found to have decreased circumferential deformation (however, this may also be decreased in restrictive cardiomyopathy). Longitudinal strain and longitudinal early diastolic velocity remain preserved in constriction but are decreased in restriction. [22, 26]
Doppler interrogation can be limited if patients cannot adequately vary their respiration or if concomitant myocardial disease, atrial fibrillation, or severe lung disease (eg, chronic obstructive pulmonary disease [COPD], which can lead to false-positive findings) is present. Because Doppler transmitral inflow respiratory variation can occur in COPD, other differences must then be examined. For example, the marked increase in inspiratory superior vena cava systolic flow seen in COPD is not seen in constriction. [27]
Measurements of diastolic function are load-dependent (ie, dependent on preload and afterload). If atrial and ventricular filling pressures are low, Doppler interrogation findings may be falsely negative. Likewise, if atrial and ventricular filling pressures are high, respiratory variation may be masked. In such cases, preload may be reduced with either medication or dynamic maneuvers, such as tilting the patient’s head up or having the patient sit. These maneuvers may unmask respiratory variation.
Computed Tomography Scanning
Conventional computed tomography (CT) scanners may not help adequately visualize the parietal pericardium. However, the parietal pericardium can be visualized well using high-resolution CT. The pericardial thickness, the degree of calcification, and the distribution of these findings are easily measured.
The normal pericardium is 1-2 mm thick. A pericardial thickness of 3-4 mm or more is considered abnormal. Pericardial thickening that exceeds 4 mm assists in differentiating constrictive disease from restrictive cardiomyopathy, and thickening that exceeds 6 mm adds even more specificity for constriction.
CT is perhaps the best modality at identifying pericardial calcification. Although neither completely sensitive nor specific, pericardial calcification is often associated with constriction.
Supportive findings suggesting impaired right ventricular filling include dilation of the vena cava, hepatic vein, and right atrium as well as ascites or hepatosplenomegaly. Cine imaging (from a retrospective gated study) may demonstrate the early diastolic interventricular septal bounce or inflammatory pericardial tethering.
False-negative results may occur if a long-standing thin pericardial scar without appreciable thickening is present. That is, normal pericardial thickness does not exclude pericardial constriction, and the clinical situation must always be taken in account. Therefore, if the hemodynamics and presentation are otherwise compatible, the diagnosis of constrictive pericarditis must still be entertained even when pericardial imaging yields unremarkable results.
In those patients who have an established diagnosis of constriction, CT scanning may provide helpful information for preoperative planning. This is particularly true in individuals with previous cardiothoracic surgery, helping to identify anatomic relationships, adhesions, and bypass graft locations. Coronary calcium as well as potential coronary stenoses may be identified. Pericardial calcification location and severity may lead the surgeon towards a particular approach or help identify regions of the pericardium needing particular attention at the time of resection.
CT scanning may also be used to identify associated radiation lung injury in radiation-induced constriction.
Magnetic Resonance Imaging
The development of real-time, high-resolution magnetic resonance imaging (MRI) and the ability to acquire images in 50 ms or less makes MRI a sensitive method for imaging the pericardium. [28, 29] The European Society of Cardiology recommends both computed tomography scanning (CT) and MRI as second-level imaging techniques for the evaluation of constrictive pericarditis, including assessing calcifications (CT scanning), pericardial thickness, and degree and extent of pericardial involvement, with class I, level C level of evidence. [18] Cardiac MRI also has high diagnostic accuracy in the setting of recurrent pericarditis and for identifying patients at higher risk of complications). [30]
Like CT scanning, MRI can be used to measure the pericardium for thickness (see the image below), calcification, and other anatomic abnormalities. Features notable on MRI and associated with constriction include an elongated, narrow right ventricle (“tubing of the ventricle”), atrial dilation, and a characteristic intraventricular septal “bounce” in early diastole. This septal bounce is associated with ventricular interdependence. The septum may have a sigmoid appearance. Real-time, steady-state free-procession (SSFP) imaging can be used to assess ventricular coupling, which allows assessment of changes in the ventricular septal shape and motion over the respiratory cycle. Gated MRI has an advantage in determining whether pericardial fluid is hemorrhagic. CT scanning may be preferable when pericardial calcification is particularly prominent. [18, 31]
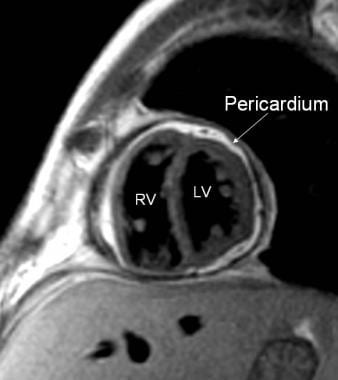 Constrictive Pericarditis. The magnetic resonance image shows constrictive pericarditis in 13-year-old patient with an otherwise structurally normal heart. Infectious workup was negative. (Image courtesy of Tal Geva, MD.)
A thickened pericardium does not prove that constrictive pericarditis is present; it must be clinically correlated. Likewise, the absence of pericardial thickening does not rule out hemodynamically significant restrictive pericarditis; constriction can occur in a scarred fibrous pericardium of normal thickness.
MRI with gadolinium administration may identify those patients with constrictive pericarditis with a reversible component. A small study examining myocardial inflammation using MRI with gadolinium noted association of greater pericardial thickness and increased degree of qualitative late gadolinium enhancement as being associated with reversible constrictive pericarditis. It was thought that increased pericardial thickness and increased gadolinium enhancement correlated with increased inflammation that would respond to traditional anti-inflammatory therapy (nonsteroidal anti-inflammatory drugs [NSAIDs] and corticosteroids). [32, 33] In patients who may have inflammatory constriction that would resolve with anti-inflammatory therapy, cardiac MRI may be helpful in the diagnostic workup. [34]
Cremer et al looked at pericardial delayed hyperenhancement as a predictor of clinical improvement in patients with constrictive pericarditis. [35] They were able for the first time to quantify improvement in patients treated with anti-inflammatory agents who had increased pericardial delayed hyperenhancement. [35]
A study by Amaki et al indicated that when it comes to differentiating constrictive pericarditis from restrictive cardiomyopathy, comparable diagnostic information can be derived from left ventricular mechanics using either cine MRI–based tissue tracking or two-dimensional echocardiography–based tissue tracking. [36]
Electrocardiography
No electrocardiographic signs are diagnostic for constriction. The electrocardiogram in constriction most often shows nonspecific ST-T segment abnormalities. The diagnostician might be tempted to look for findings similar to those in pericarditis. However, chronic pericarditis (sometimes associated with constriction) is not associated with the classic electrocardiographic (ECG) findings seen with acute pericarditis.
Findings of acute pericarditis generally include diffuse concave ST-segment elevation that must be distinguished from other causes of ST elevation with PR depression. In most instances of acute pericarditis, the magnitude of the ST elevation is greater than one fourth of the T-wave height in the lateral V leads. If a history of these findings exists, the later development of constrictive pericarditis should be considered. The above findings are contrasted with the patient with restrictive cardiomyopathy who may have diffuse low-voltage tracings, bundle-branch block, or AV conduction abnormalities.
Over time, even if chronic pericarditis develops, no specific ECG patterns develop. Inverted T waves may persist, or all ECG findings may resolve to normal. In long-standing cases, atrial fibrillation may occur, but this is certainly nonspecific.
If a pericardial effusion develops, a low QRS voltage may be present in the limb and chest leads. This must be distinguished from other causes of low voltage, such as long-standing myocardial infarction (MI), pleural effusion, postoperative state, or various cardiomyopathies.
When electrical alternans (a beat-to-beat cyclic shift in the QRS axis that may also involve the P and T waves) is present, cardiac tamponade must be considered.
Right-Sided Heart Catheterization
Despite data from the history, physical findings, laboratory results, and noninvasive testing, an accurate diagnosis of constrictive pericarditis may be difficult to make. When this diagnosis is not absolute, despite all of the available information, invasive procedures, such as right heart catheterization, can help make or exclude the diagnosis. [18] .
The traditional hemodynamic criteria for constrictive pericarditis are as follows:
-
Elevated left and right ventricular diastolic pressures equalized within 5 mm Hg (See the image below)
-
Right ventricular systolic pressure less than 55 mm Hg
-
Mean right arterial pressure greater than 15 mm Hg
-
Right ventricular end-diastolic pressure greater than one third of the right ventricular systolic pressure (narrow pulse pressure)
In the absence of these criteria, a diagnosis of restrictive pericarditis is favored. [37]
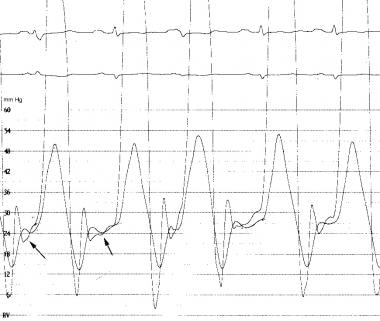 Constrictive Pericarditis. The simultaneous right and left ventricular pressure tracings shows diastolic equalization of pressures in both ventricles in a patient with constrictive pericarditis.
In addition, one would expect to see an exaggerated x descent with a steep y descent on right arterial pressure waveforms (W sign), as well as the square root sign (dip-and-plateau) on right or left ventricular tracings, which distinguishes this diagnosis from cardiac tamponade (see the image below). Another hemodynamic parameter is the Kussmaul sign, which is failure of the right arterial pressure to decrease with inspiration. However, this can also be seen in right-heart failure, severe tricuspid regurgitation, and systemic venous congestion. [5]
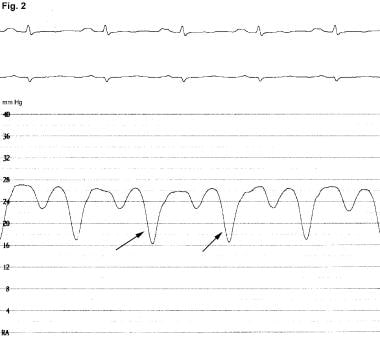 Constrictive Pericarditis. This right atrial pressure tracing shows marked y descents (arrows) in a patient with constrictive pericarditis.
The respiratory variations in intrathoracic pressures are not transmitted to the cardiac chambers in constriction, and this leads to decreased left-side filling on inspiration in comparison with the right side.
Talreja et al, in a study examining the areas under the right and left ventricular curves during inspiration and expiration, found a 100% positive predictive accuracy, a 97% sensitivity, and a 100% specificity for constriction with a systolic area index greater than 1.1 (comparing expiration with peak inspiration). This was not a randomized controlled clinical study, and there was selection bias; however, this may prove to be another standard diagnostic criterion in the future. [38]
Although these signs are useful, in practice there is always some uncertainty when they are used in efforts to diagnose constrictive pericarditis. Fluid-filled catheters render notoriously poor fidelity tracings, which can lead to a misinterpretation of the hemodynamic data. Irregular rhythms, such as atrial fibrillation, may alter ventricular filling pressures on the basis of the varying RR intervals.
The patient’s diastolic filling pressures can affect hemodynamic measurements, and some authors advocate infusing isotonic sodium chloride solution if the patient’s left ventricular end-diastolic pressure is less than 15 mm Hg in order to unmask occult constrictive pericarditis. Conversely, if the filling pressures are too high, subtle respiratory variations in pressure may be missed. [9]
Important causes of diastolic pressure equalization that should be considered in the differential diagnosis include the following:
-
Restrictive cardiomyopathy
-
Cardiac tamponade
-
Chronic obstructive pulmonary disease (COPD) and pneumothorax (pulmonary hyperinflation)
-
Dilated cardiomyopathy (which, if severe, may cause all filling pressures to be high)
-
Atrial septal defect
-
Volume depletion (when all filling pressures are low)
Pericardial and Endomyocardial Biopsy
Occasionally, direct inspection and pericardial biopsy may be required to diagnose constriction. Myocardial histologic findings include fibrotic thickening, chronic inflammation, granulomas, and calcification.
If constriction is strongly suggested on clinical grounds (despite imaging and hemodynamic data), direct surgical inspection, biopsy, and pericardiectomy may be required. This should only be undertaken after careful consideration to establish or exclude the diagnosis. [39]
Despite the best attempts at diagnosing constrictive pericarditis, confirming the diagnosis may be impossible until the time of surgical evaluation. Patients and their families need to be mindful of this fact and aware that, in some cases, surgery may be considered exploratory.
-
Constrictive Pericarditis. These images are anteroposterior and lateral chest radiographs from a patient with tuberculous constrictive pericarditis (arrows denote marked pericardial calcification).
-
Constrictive Pericarditis. This right atrial pressure tracing shows marked y descents (arrows) in a patient with constrictive pericarditis.
-
Constrictive Pericarditis. The simultaneous right and left ventricular pressure tracings shows diastolic equalization of pressures in both ventricles in a patient with constrictive pericarditis.
-
Constrictive Pericarditis. The magnetic resonance image shows constrictive pericarditis in 13-year-old patient with an otherwise structurally normal heart. Infectious workup was negative. (Image courtesy of Tal Geva, MD.)
-
Constrictive Pericarditis. The image depicts a left ventricular volume curve in constrictive pericarditis.


