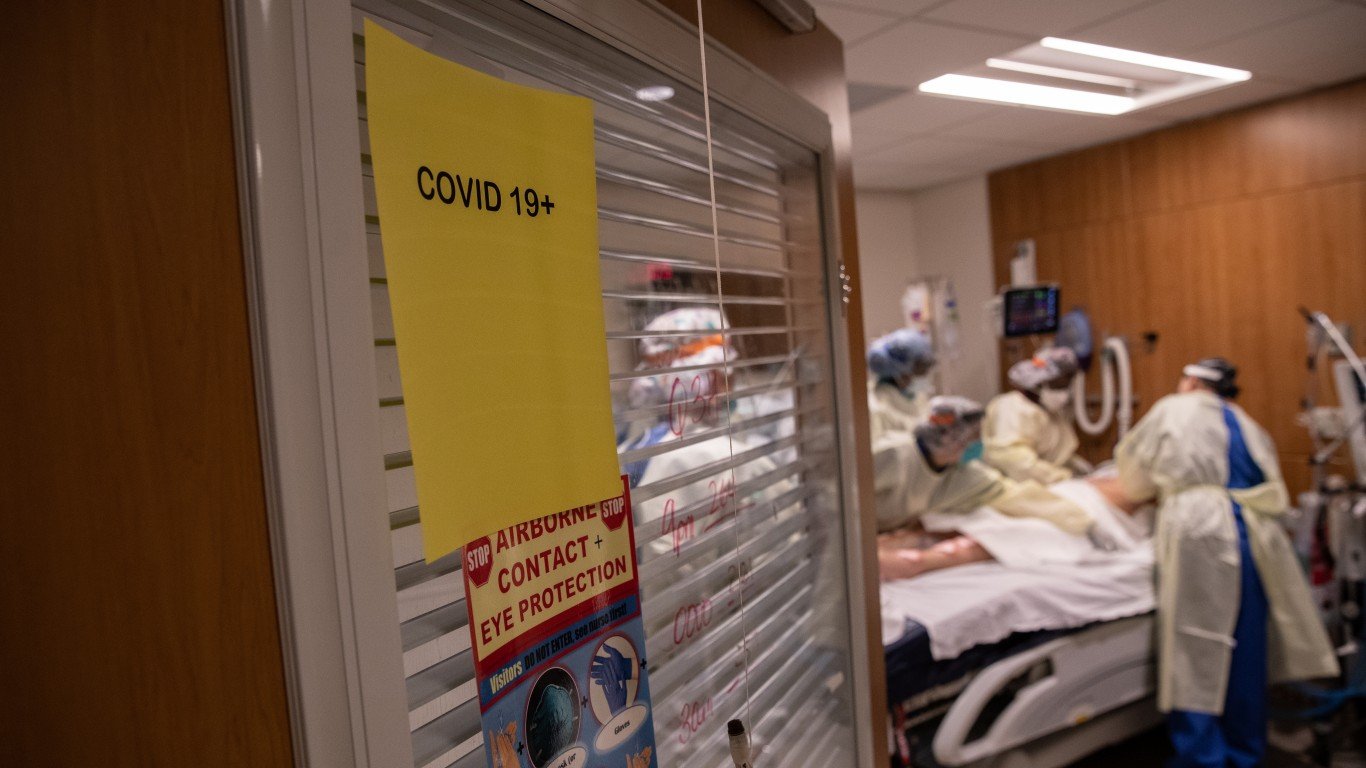

The Biden Administration has announced that it expects to have enough coronavirus vaccines for every American adult by the end of May. Achieving this goal will, hopefully, allow life in the United States to return to some degree of normalcy after COVID-19 wreaked havoc for well over a year. So far, the virus has claimed 504,935 American lives — more than the total number of Americans killed in World War I and World War II combined.
In the New York-Newark-Jersey City metropolitan area, which covers parts of New York, New Jersey, and Pennsylvania, a total of 49,327 deaths have been attributed to the virus, equal to 247 fatalities for every 100,000 people. Nationwide, 154 deaths have been attributed to the virus per 100,000 people.
The higher than average per capita COVID-19 death rate across the metro area is being driven disproportionately by one area in particular.
The broader New York metro area comprises 25 counties or county equivalents — and of them, Essex County has had the most COVID-19 fatalities per capita. So far, the per capita coronavirus death rate in Essex County stands at 340 for every 100,000 people.
With the highest per capita death rate in the New York-Newark-Jersey City metro area, Essex County ranks among the top 10% of all U.S. counties or county equivalents with at least one COVID-19 fatality by death rate per capita.
All COVID-19 data used in this story are current as of March 4, 2021.
| Rank: | Geography: | Deaths per 100,000 people: | Total deaths: | Confirmed cases per 100,000 people: | Total confirmed cases: |
|---|---|---|---|---|---|
| 1 | Essex, NJ | 340 | 2,695 | 9,434 | 74,861 |
| 2 | Passaic, NJ | 339 | 1,707 | 11,449 | 57,708 |
| 3 | Union, NJ | 322 | 1,782 | 10,420 | 57,632 |
| 4 | Ocean, NJ | 319 | 1,887 | 10,103 | 59,803 |
| 5 | Hudson, NJ | 302 | 2,021 | 10,539 | 70,465 |
| 6 | Bronx, NY | 287 | 4,127 | 9,805 | 140,981 |
| 7 | Bergen, NJ | 283 | 2,629 | 8,530 | 79,332 |
| 8 | Queens, NY | 275 | 6,314 | 9,179 | 210,971 |
| 9 | Middlesex, NJ | 257 | 2,121 | 8,920 | 73,743 |
| 10 | Kings, NY | 250 | 6,497 | 8,077 | 210,074 |
| 11 | Somerset, NJ | 238 | 787 | 7,038 | 23,239 |
| 12 | Morris, NJ | 228 | 1,127 | 7,729 | 38,209 |
| 13 | Monmouth, NJ | 228 | 1,421 | 9,322 | 58,113 |
| 14 | Richmond, NY | 221 | 1,050 | 12,118 | 57,451 |
| 15 | Westchester, NY | 218 | 2,116 | 11,255 | 109,038 |
| 16 | Nassau, NY | 216 | 2,935 | 11,097 | 150,538 |
| 17 | Rockland, NY | 213 | 689 | 12,095 | 39,149 |
| 18 | Suffolk, NY | 209 | 3,105 | 11,058 | 164,539 |
| 19 | Sussex, NJ | 193 | 275 | 6,538 | 9,303 |
| 20 | Orange, NY | 171 | 645 | 9,949 | 37,631 |
| 21 | New York, NY | 165 | 2,690 | 6,553 | 106,982 |
| 22 | Dutchess, NY | 140 | 410 | 7,716 | 22,678 |
| 23 | Hunterdon, NJ | 130 | 163 | 5,661 | 7,079 |
| 24 | Putnam, NY | 87 | 86 | 8,539 | 8,460 |
| 25 | Pike, PA | 86 | 48 | 4,672 | 2,593 |
Sponsored: Attention Savvy Investors: Speak to 3 Financial Experts – FREE
Ever wanted an extra set of eyes on an investment you’re considering? Now you can speak with up to 3 financial experts in your area for FREE. By simply
clicking here you can begin to match with financial professionals who can help guide you through the financial decisions you’re making. And the best part? The first conversation with them is free.
Click here to match with up to 3 financial pros who would be excited to help you make financial decisions.
Thank you for reading! Have some feedback for us?
Contact the 24/7 Wall St. editorial team.


