- Litecoin price consolidates below a crucial demand zone extending from $210 to $232.
- A decisive close above this barrier will propel LTC to $300.
- On-chain metrics reveal massive headwinds for the altcoin.
Litecoin price is in a tough spot as technicals hint at a bullish outlook if the altcoin can manage to close above one particular hurdle. However, on-chain metrics indicate that an ascent would be an uphill battle. Therefore, investors need to be careful with taking on LTC.
Litecoin price in an ambiguous situation
Litecoin price set up a swing high at $232 on September 5 and began its 40% descent. This downswing breached the previous swing low at $162, indicating a downswing is in play. Therefore, it is obvious to assume that a bunch of traders positioned themselves short on the October 21 swing high at $214.
The stop losses for these positions are placed above the $210 to $232 supply zone. A decisive daily close above $232 will put many investors that went short in a challenging situation and force them to buy back their positions at a higher price.
If Litecoin price stays above this barrier, it would be an indication to go long. A perfect retest of the $210 to $232 demand zone will likely propel Litecoin price to the next hurdle at $294. In some cases, the uptrend might extend to a psychological level at $300. This run-up from the current position would constitute a 55% gain.
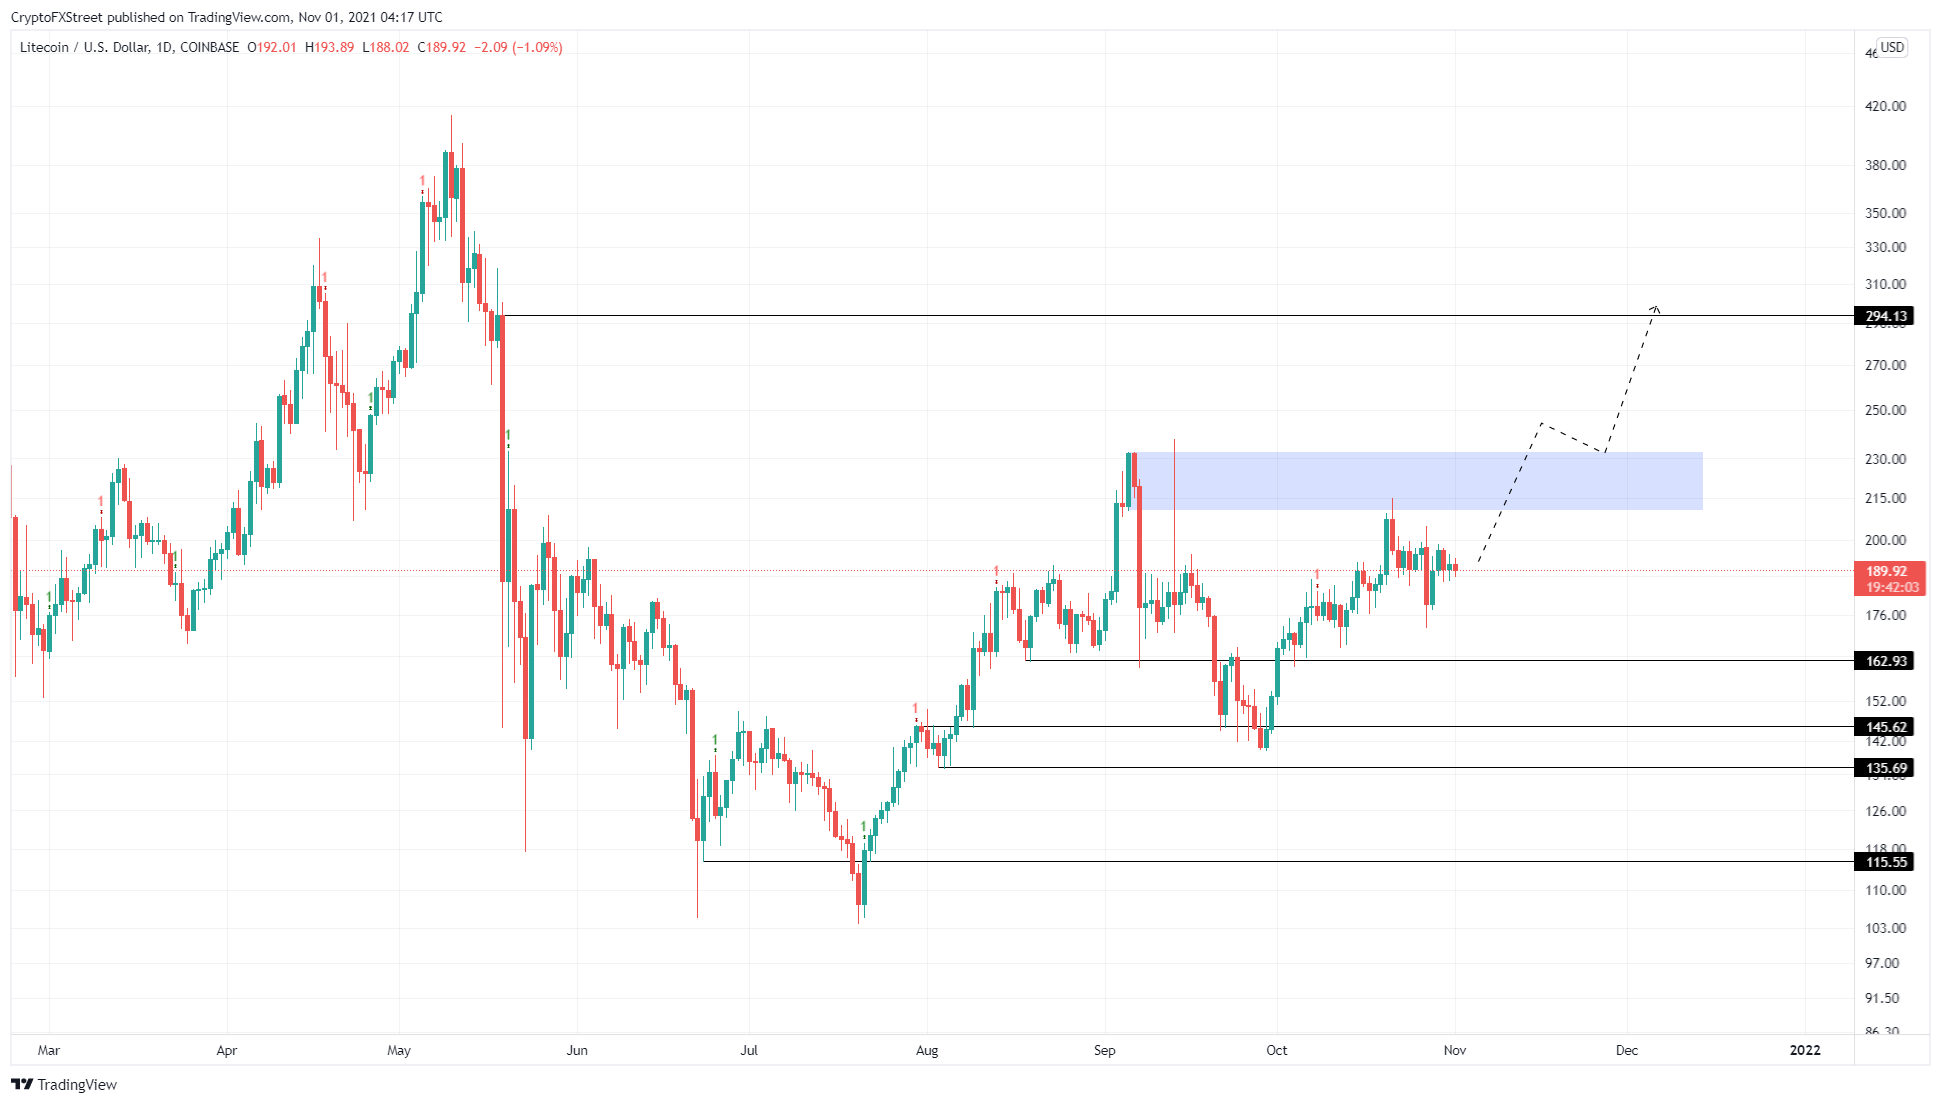
LTC/USDT 1-day chart
Supporting this bullish outlook for Litecoin price is the 365-day and the 30-day Market Value to Realized Value (MVRV) model. This on-chain metric is used to determine the average profit/loss of investors that purchased LTC over the past year or month.
From the looks of it, both time frames show that the MVRV is in the safe zone, suggesting that a sell-off from the holders is unlikely since they are not profitable.
 [09.22.57, 01 Nov, 2021]-637713397558416017.png)
LTC 30-day, 365-day MVRV chart
While the MVRV chart shows the possibility of an uptrend, IntoTheBlock’s In/Out of the Money Around Price (IOMAP) model shows that LTC will face resistance from a massive chunk of underwater investors.
At roughly $200, nearly 132,000 addresses that purchased 4.73 million LTC are “Out of the Money.” Beyond this, a similar cluster of underwater investors bought 12.59 million LTC at an average price of $265.09.
Therefore, clearing the demand zone’s upper limit at $232 will flip the first chunk of underwater investors profitable and serve as a tailwind. If this buying pressure persists and propels LTC past $265, it will solidify Litecoin price’s bullish thesis, i.e. a move to $300.
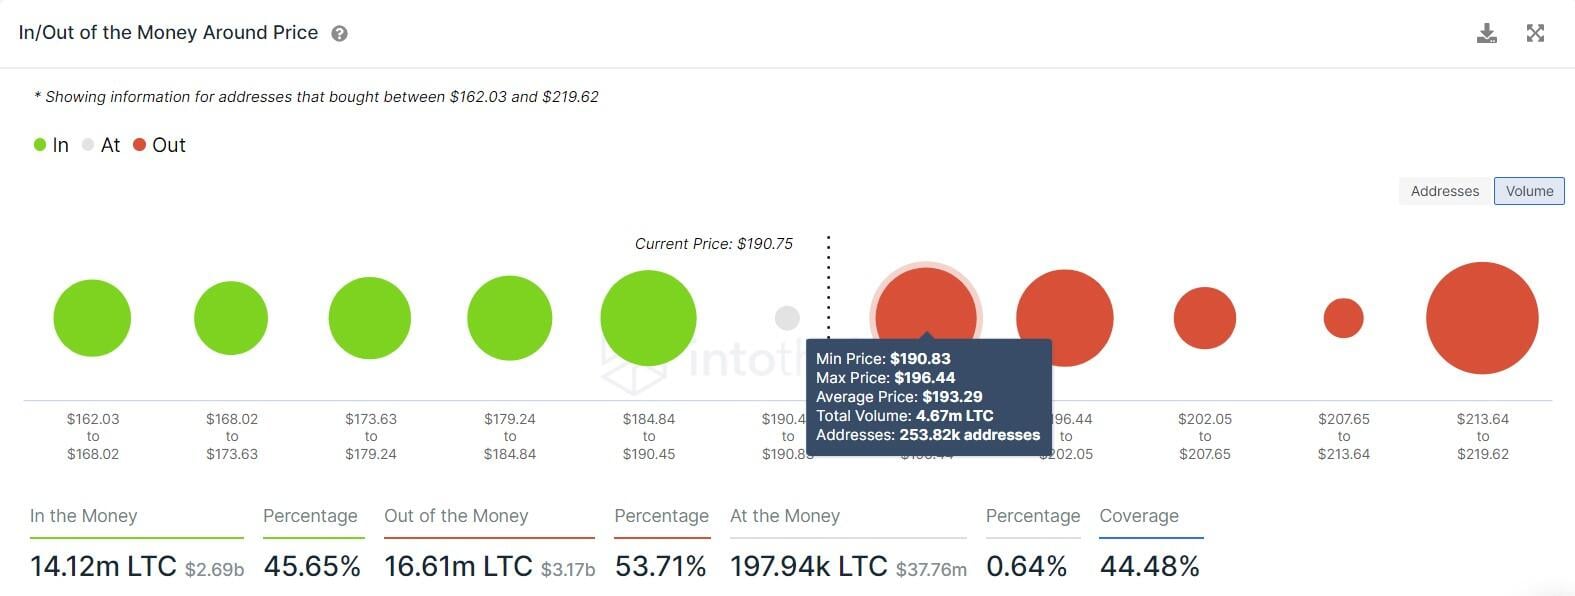
LTC IOMAP chart
However, a failure to flip $200 will provide bears an advantage and knock LTC down to the $162 support floor. If Litecoin price breaks down the $135 foothold, it will invalidate the bullish thesis and drag LTC down with it and perhaps visit $115.
Information on these pages contains forward-looking statements that involve risks and uncertainties. Markets and instruments profiled on this page are for informational purposes only and should not in any way come across as a recommendation to buy or sell in these assets. You should do your own thorough research before making any investment decisions. FXStreet does not in any way guarantee that this information is free from mistakes, errors, or material misstatements. It also does not guarantee that this information is of a timely nature. Investing in Open Markets involves a great deal of risk, including the loss of all or a portion of your investment, as well as emotional distress. All risks, losses and costs associated with investing, including total loss of principal, are your responsibility. The views and opinions expressed in this article are those of the authors and do not necessarily reflect the official policy or position of FXStreet nor its advertisers. The author will not be held responsible for information that is found at the end of links posted on this page.
If not otherwise explicitly mentioned in the body of the article, at the time of writing, the author has no position in any stock mentioned in this article and no business relationship with any company mentioned. The author has not received compensation for writing this article, other than from FXStreet.
FXStreet and the author do not provide personalized recommendations. The author makes no representations as to the accuracy, completeness, or suitability of this information. FXStreet and the author will not be liable for any errors, omissions or any losses, injuries or damages arising from this information and its display or use. Errors and omissions excepted.
The author and FXStreet are not registered investment advisors and nothing in this article is intended to be investment advice.
Recommended Content
Editors’ Picks
Ripple wipes out weekly gains, experts comment on role of Ripple stablecoin

Ripple declined to $0.52 on Thursday, erasing all gains registered earlier this week. Ripple SVP Eric van Miltenburg’s comments on the firm’s stablecoin, and how it is expected to benefit the XRP Ledger and native token XRP have raised concerns among crypto experts.
Hedera HBAR slips nearly 10% after air is cleared on mistaken link with giant BlackRock
HBAR price is down nearly 10% on Thursday, partly erasing gains inspired by the misinterpreted link with BlackRock. Despite the recent correction, Hedera’s price is up 44% in the past seven days.
The reason behind Bonk’s 105% rise and if you should buy now Premium

Bonk price has shot up 105% in the past five weeks. A retracement into $0.0000216 or the $0.0000152 to $0.0000186 imbalance would be a good buying opportunity. Patient investors can expect double-digit gains from BONK that could extend up to 70%.
Injective price weakness persists despite over 5.9 million INJ tokens burned
Injective price is trading with a bearish bias, stuck in the lower section of the market range. The bearish outlook abounds despite the network's deflationary efforts to pump the price. Coupled with broader market gloom, INJ token’s doomed days may not be over yet.
Bitcoin: BTC post-halving rally could be partially priced in Premium

Bitcoin (BTC) price briefly slipped below the $60,000 level for the last three days, attracting buyers in this area as the fourth BTC halving is due in a few hours. Is the halving priced in for Bitcoin? Or will the pioneer crypto note more gains in the coming days?