Should You Be Tempted To Sell Home Capital Group Inc. (TSE:HCG) Because Of Its P/E Ratio?

Today, we'll introduce the concept of the P/E ratio for those who are learning about investing. We'll look at Home Capital Group Inc.'s (TSE:HCG) P/E ratio and reflect on what it tells us about the company's share price. What is Home Capital Group's P/E ratio? Well, based on the last twelve months it is 11.35. That means that at current prices, buyers pay CA$11.35 for every CA$1 in trailing yearly profits.
View our latest analysis for Home Capital Group
How Do You Calculate A P/E Ratio?
The formula for P/E is:
Price to Earnings Ratio = Price per Share ÷ Earnings per Share (EPS)
Or for Home Capital Group:
P/E of 11.35 = CA$26.040 ÷ CA$2.295 (Based on the year to December 2019.)
(Note: the above calculation results may not be precise due to rounding.)
Is A High Price-to-Earnings Ratio Good?
A higher P/E ratio implies that investors pay a higher price for the earning power of the business. All else being equal, it's better to pay a low price -- but as Warren Buffett said, 'It's far better to buy a wonderful company at a fair price than a fair company at a wonderful price'.
How Does Home Capital Group's P/E Ratio Compare To Its Peers?
The P/E ratio indicates whether the market has higher or lower expectations of a company. You can see in the image below that the average P/E (9.7) for companies in the mortgage industry is lower than Home Capital Group's P/E.
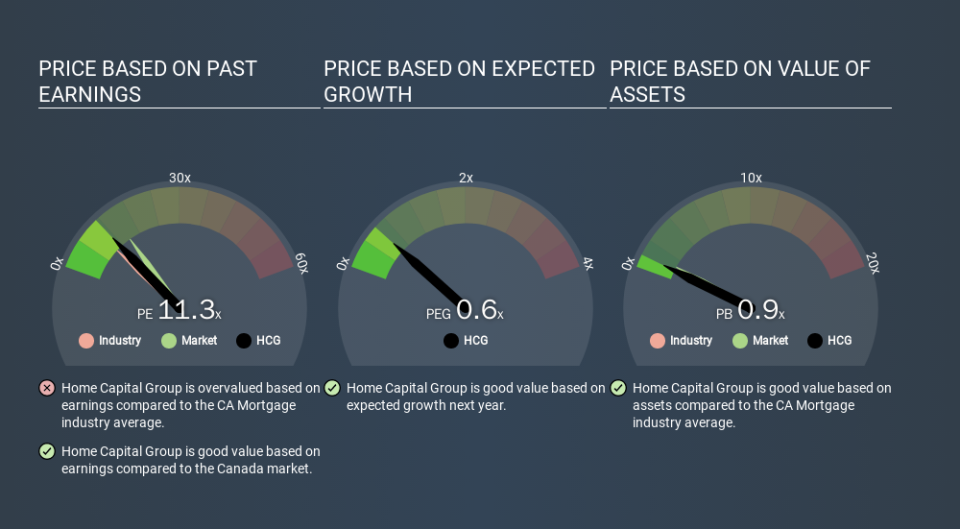
That means that the market expects Home Capital Group will outperform other companies in its industry. The market is optimistic about the future, but that doesn't guarantee future growth. So investors should always consider the P/E ratio alongside other factors, such as whether company directors have been buying shares.
How Growth Rates Impact P/E Ratios
If earnings fall then in the future the 'E' will be lower. That means unless the share price falls, the P/E will increase in a few years. A higher P/E should indicate the stock is expensive relative to others -- and that may encourage shareholders to sell.
Notably, Home Capital Group grew EPS by a whopping 38% in the last year. But earnings per share are down 13% per year over the last five years.
Don't Forget: The P/E Does Not Account For Debt or Bank Deposits
Don't forget that the P/E ratio considers market capitalization. Thus, the metric does not reflect cash or debt held by the company. Theoretically, a business can improve its earnings (and produce a lower P/E in the future) by investing in growth. That means taking on debt (or spending its cash).
Such expenditure might be good or bad, in the long term, but the point here is that the balance sheet is not reflected by this ratio.
Home Capital Group's Balance Sheet
Home Capital Group has net debt worth a very significant 171% of its market capitalization. This level of debt justifies a relatively low P/E, so remain cognizant of the debt, if you're comparing it to other stocks.
The Verdict On Home Capital Group's P/E Ratio
Home Capital Group's P/E is 11.3 which is below average (14.7) in the CA market. The company has a meaningful amount of debt on the balance sheet, but that should not eclipse the solid earnings growth. If it continues to grow, then the current low P/E may prove to be unjustified.
When the market is wrong about a stock, it gives savvy investors an opportunity. If it is underestimating a company, investors can make money by buying and holding the shares until the market corrects itself. So this free report on the analyst consensus forecasts could help you make a master move on this stock.
You might be able to find a better buy than Home Capital Group. If you want a selection of possible winners, check out this free list of interesting companies that trade on a P/E below 20 (but have proven they can grow earnings).
If you spot an error that warrants correction, please contact the editor at editorial-team@simplywallst.com. This article by Simply Wall St is general in nature. It does not constitute a recommendation to buy or sell any stock, and does not take account of your objectives, or your financial situation. Simply Wall St has no position in the stocks mentioned.
We aim to bring you long-term focused research analysis driven by fundamental data. Note that our analysis may not factor in the latest price-sensitive company announcements or qualitative material. Thank you for reading.
