Patient and Methods
Study Population
This prospective study was approved by Central Northern Adelaide Health Service Ethics of Human Research Committee. Patients who were referred for colonoscopy for either screening or surveillance colonoscopy were invited to participate. Patients were excluded if they were pregnant, lactating, or had severe comorbidities.
Colonoscopy Procedure
As per standard protocol, all patients received the standard preparation of two sachets of sodium picosulfate (Picolax, Dendy Pharmaceuticals, Dendy, Victoria, Australia) and one sachet of sodium sulfate (Colonlytely, Dendy Pharmaceuticals) as a split preparation prior to the procedure. Sedation was provided during the procedure with intravenous midazolam and propofol. The colonoscopy was conducted by a single-experienced endoscopist (RS). A high-definition colonoscope (Olympus PCF-HI80AL Exera II, Olympus Co. Ltd., Melbourne, Victoria, Australia) was utilized for all procedures. Following cecal intubation, slow withdrawal of the colonoscope allowed for careful visualization of the colonic mucosa with hWLE. On detection of diminutive polyps (defined as measuring ≤ 5 mm), further assessment with hWLE followed by NBI was performed. These assessments were digitally recorded (high-definition video, 30 frames/s). After the video was recorded, polypectomy was performed, and each polyp was then sent for histopathological examination.
Polyp Classification
Based on the classification used in two recent studies[14,15] and reviewing our library of 200 images (which was not used in the subsequent evaluation by the endoscopists), two experts (RS, WT) classified polyps in a simplified manner as follows:


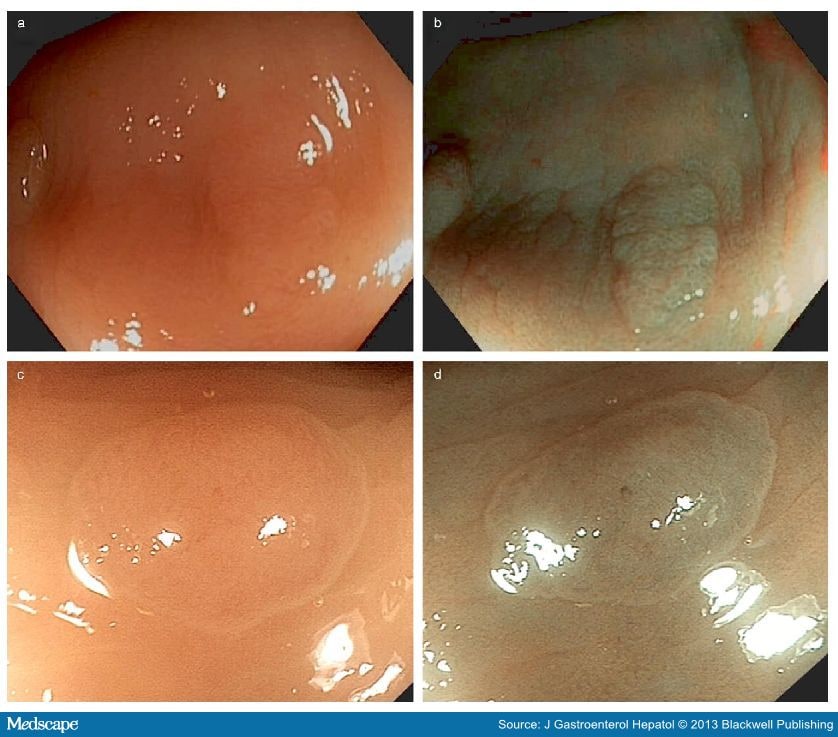
Figure 1.
Type 1 hyperplastic: circular white pits with central dark spots (a,b); type 2 hyperplastic: absent pits with absent/very fine capillary network across polyp surface (c,d).

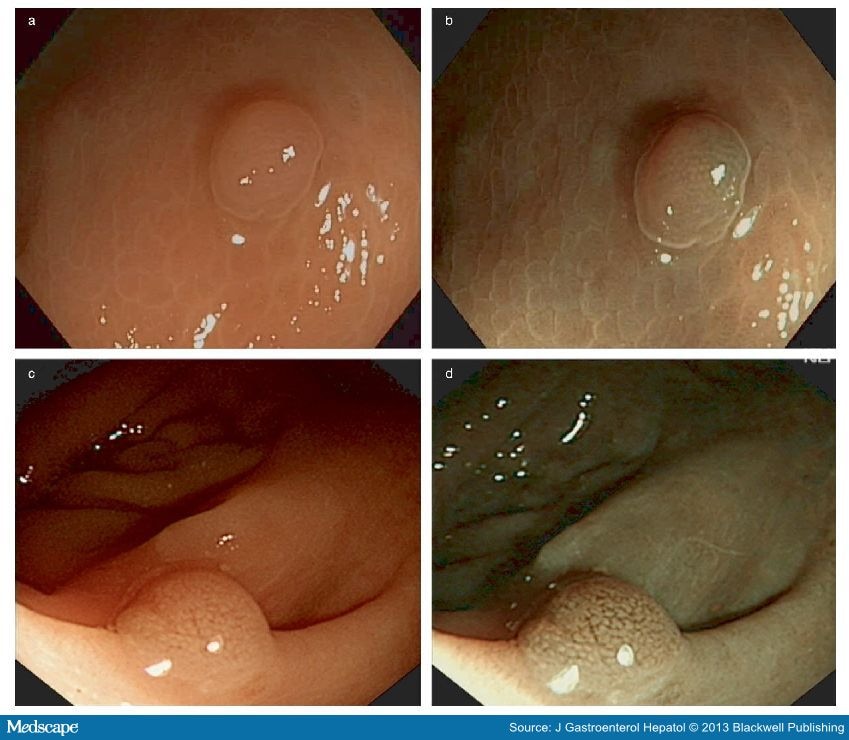
Figure 2.
Type 3 hyperplastic: circular white pits with very fine capillary network bordering the pits (a,b); type 4 adenoma: circular/oval/linear/cerebriform pits (central white configuration with dark vessels bordering the pits) (c,d).
We were unable to classify two hyperplastic and four adenomas because of:
Insufficient quality of the image (one hyperplastic and one adenoma),
Misclassification (two adenomas), and
Failure to retrieve the polyp for histology (one hyperplastic and one adenoma).
Video Formatting and Editing
The recorded videos were formatted into high-resolution Windows Media Video files using the U Lead Video Studio 11 Movie-Making Software (Copyright© Corel Corporation, Ottawa, Ontario, Canada). Ten- to thirty-second video recordings were made, all of which ended with the best representative still image of each video sequence that lasted at least 5 s. This was deliberately performed to simulate real-time endoscopy and allow each assessor to study the mucosal morphology of each polyp before predicting the histology.
Assessment Procedure
Fifty polyps were imaged with both hWLE and NBI producing 100 videos, which were collected on consecutive patients. These videos were placed in random order and separated into five folders—each consisting of 20 videos. Eight endoscopists with little or no experience with NBI working at different centers (each having performed at least 1000 colonoscopies) were invited to participate in evaluation of the videos. They were required to document the histological diagnosis of the polyp (hyperplastic vs adenomas) based on the videos, and this was then compared with the final histopathology.
The endoscopists were asked to assess the first folder of 20 polyps. The outcome of this assessment was considered the pretest result (see flow chart, Fig. 3). Feedback on their individual performance was provided after each folder was viewed (folders 1–4, each with 20 videos). An educational DVD on the mucosal morphological classification of polyps was provided once the pretest folder of 20 polyps was assessed. This DVD was then made available for viewing throughout the study. To look for a learning curve, the initial 20 polyps (pretest) were randomly reordered and graded again at the end of the study (post-test). Overall, 800 videos comprising of (400 hWLE and 400 NBI) were reviewed by the eight assessors.

Figure 3.
Flow chart of study design.
Outcome Measures
The outcome measures included:
Sensitivity (Sn), specificity (Sp), positive predictive value (PPV), negative predictive value (NPV), and accuracy (Acc) in predicting polyp histology with hWLE and NBI.
The presence of a learning curve (pretest vs post-test).
Interobserver agreement (K = kappa).
Statistical Analysis
The predicted histology and actual polyp histology were compared to determine the Sn, Sp, PPV, NPV, and Acc of hWLE and NBI separately using the Fisher's exact test. Use of the Polychromic Correlation Matrix (SPSS Version 18.0.2, IBM Corp., Armonk, NY, USA) enabled data from all 8 endoscopists to be correlated into the analysis for calculation of interobserver agreement.
J Gastroenterol Hepatol. 2013;28(3):472-478. © 2013 Blackwell Publishing