Want more state education news? Sign up for The Alabama Education Lab’s free, weekly newsletter, Ed Chat.
Test results for Alabama’s public school students were released last week and showed more students reaching proficiency benchmarks on the state’s annual test this year than last year.
And while that top-level finding is a good one, Alabama Education Lab dug a little deeper to see what district- and school-level results said about how our kids are doing in school. The results include performance on the Alabama Comprehensive Assessment Program (ACAP) and the ACT college entrance exam with writing, given to all juniors.
Here’s a link to an online dashboard where you can sort through the variables to see for yourself what test results are at the school-level by student group, by grade, and by race and ethnicity.
#1 - Fewer than half of Alabama’s students are proficient in all subjects tested: math, science or English language arts. Though proficiency levels statewide are up, they’re not up by much. State education leaders say there is a lot of work to do, but the levels are at least headed in the right direction.
Students in grades two through eight are tested in English language arts and in math. Second-grade results are not made public but are used to calculate growth scores for third graders. Students in fourth and eighth grades are tested in science.
Click here if you are unable to see the table below.
#2 - There are whole schools where 0% of students showed proficiency in math. Seven schools–5 high schools, one middle school and one elementary school–had zero students reach proficiency in math. All are Title I schools, with poverty levels ranging from 59% to 75%.
And in science, which is only tested in fourth and eighth grades, five schools–one high school, one junior high and three elementary schools–had zero students reach proficiency. Again, all are Title I schools.
#3 - Proficiency rates in math go down as students age. Proficiency rates statewide, and in every school district drop, sometimes dramatically, from third grade to eighth grade.
For example, statewide, 39% of third graders showed proficiency in math, but only 18% of eighth graders did. Some of the more dramatic drops include Coffee County, where 62% of third graders were proficient, but 14% of eighth graders were. In Geneva City schools, 76% of third graders were proficient, but 28% of eighth graders were.
State education officials discussed the drop at Thursday’s board work session, noting that the 2021-22 school year was the first year teachers were required to teach the new math standards. The Numeracy Act, which goes into effect next year and focuses on elementary math, should also provide support to schools to ensure more even performance across grades, they said.
State education officials credit the support offered through the Alabama Literacy Act for higher and more consistent English language arts scores.
Click here if you are unable to see the table below.
#4 - Alabama students struggle with the ACT. Alabama is one of fewer than 20 states where all high school students take the ACT. The scores are part of Alabama’s state and federal report cards, too.
The percentage of students reaching proficiency – meaning reaching the benchmark score set by ACT – rose by one percentage point in ELA and science and stayed the same in math.
The range of scores at the district level was wide in all subjects, from 0% to 81% in math, from 0% to 69% in ELA, and from 0% to 76% in science.
Read more Ed Lab coverage about Alabama’s ACT outcomes here.
#5 - City school districts dominated the top of the rankings. Cities that break away from larger county school systems frequently cite a desire to create a smaller district and improve academic excellence.
Orange Beach became the 11th city to break away from its county system. Alabama has one of the highest rates of breakaway city districts in the country, according to a 2017 national report. Critics of breakaway districts say cities take a disproportionate share of the tax base away from counties when they secede.
City districts dominated the top performer ranks, with only one county district breaking into the top 20 in each subject tested.
Click here if you are unable to see the table below.
#6 - Alabama’s virtual schools showed varying results. There are three statewide virtual schools and a dozen district-level virtual schools with test results from last year. Results at the state-level virtual schools ranged from 35% to 42% in ELA, 8% to 9% in math, and 22% to 28% in science.
Proficiency levels of students attending district-level virtual schools ranged from 22% to 70% in ELA, 1% to 32% in math, and 7% to 61% in science.
#7 - Students with disabilities were the only group to lose ground statewide. Students with disabilities have historically had among the lowest proficiency levels of all groups except for students learning the English language.
State education officials say they are are placing new emphasis on outcomes for students in special education and the special education director addressed the state board at their work session laying out a game plan.
Here’s a look at three years of test results, by student group, for English language arts. Click here if you are unable to see the table.
And here are three years of math scores for the same student groups. Click here if you are unable to see the table.
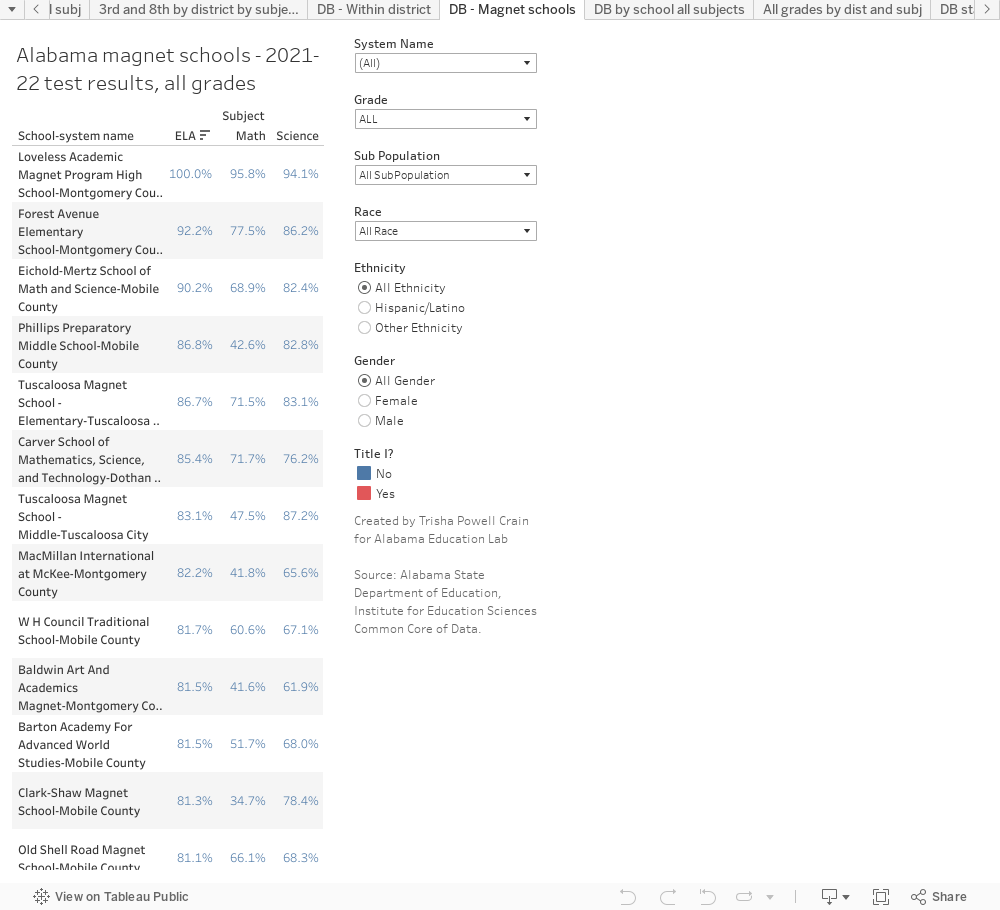
#8 - Magnet schools outperformed non-magnets in districts where they are located. Most magnet schools in Alabama have minimum admission requirements and students typically have much lower levels of poverty than other schools in their districts.
None stand out more than Montgomery’s schools where students in magnet schools far outperform the non-magnets in the district.
Here’s a look at schools given the “magnet” designation in federal documents. The table below is best viewed on a desktop or laptop. Click here if you are unable to see the table.
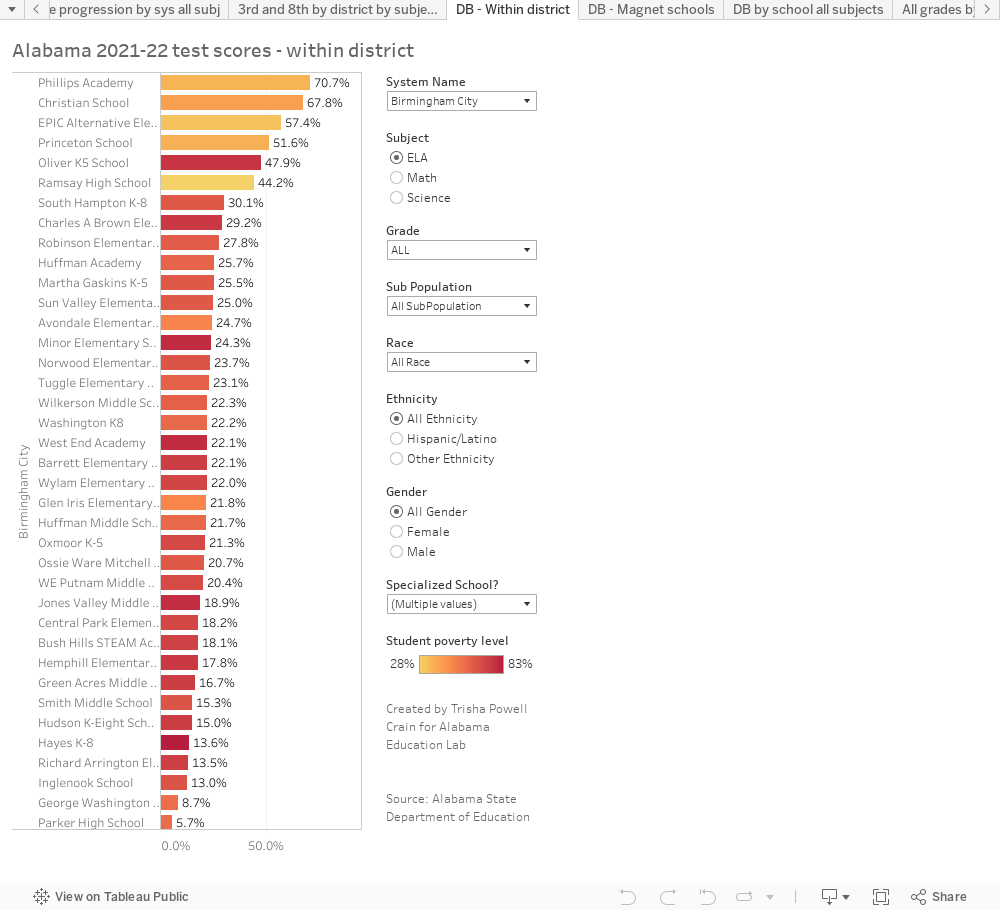
#9 - The range of student proficiency levels among schools in the same district was wide. For example, in Birmingham, math proficiency among the district’s 42 schools ranged from less than 1% to 40% and English language arts proficiency ranged from 14% to 71%.
Among the 52 schools in Jefferson County, math proficiency ranged from 1% to 57% and ELA proficiency ranged from 3% to 96%.
Use the dropdown menu to choose a district and see the range of scores. The table below is best viewed on a desktop or laptop. Click here if you are unable to see the chart below.
#10 - Charter schools offered mixed outcomes. In many of Alabama’s public charter schools, proficiency levels were higher – sometimes much higher – than surrounding schools. But not in all.
Keep in mind that charter schools can draw students from beyond the borders of the school district where it is located, which may result in a comparison that’s not apples to apples.
For example, in Sumter County, public school proficiency results in math included 0% at the high school to 3% at Livingston Junior High School. Twenty-nine percent of students at University Charter School, located in Livingston, were proficient in math.
In other areas, students in charter schools have lower proficiency levels than those in the adjoining district.
#11 (Bonus) - High student poverty levels don’t always mean low proficiency. While student and community poverty levels certainly provide challenges to learning, some schools have found ways to keep those challenges from standing in the way of student achievement.
For example, though Alabama’s performance on the ACT wasn’t stellar statewide, DeKalb County’s Plainview School, a K-12 school where 65% of students are in poverty, reached some of the highest proficiency levels on the ACT: 53% in ELA, 38% in math, and 48% in science.
The schools below all had poverty levels higher than the statewide level of 44% and had higher levels of proficiency than the overall statewide level.
Click here if you are unable to see the table.
Those are just some of the observations to be made about spring’s test results. Here’s a link to an online dashboard where you can sort through the variables to see for yourself what test results are at the school-level by student group, by grade, and by race and ethnicity. The linked table contains a lot of information and is best viewed on a desktop or laptop.