Here at Hackaday, we love to see projects re-visited and updated after we’ve covered them on the site. It’s always exciting to see what the creators come up with next, and this Pi-Based Spectrometer project is a great example of that.
[LesWright] found himself with a problem when the new version of Raspberry Pi operating system was released (Bullseye), and it broke some functionality on his original software. Rather than just fix the issues, [Les] chose to rewrite the software more dramatically and has ended up with a much more capable spectrometer that is able to match professional devices costing many times more.
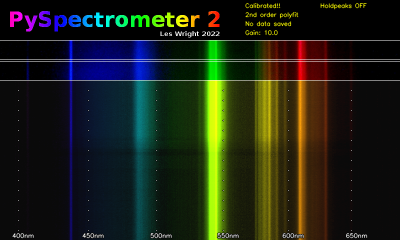
By using multi-wavelength calibration and polynomial regression data, the new version is much more accurate and can now resolve wavelengths down to +/- 1nm.
The whole project is now written in OpenCV, and there’s a nifty new waterfall spectrum display, that will show changes in measured spectra over time.
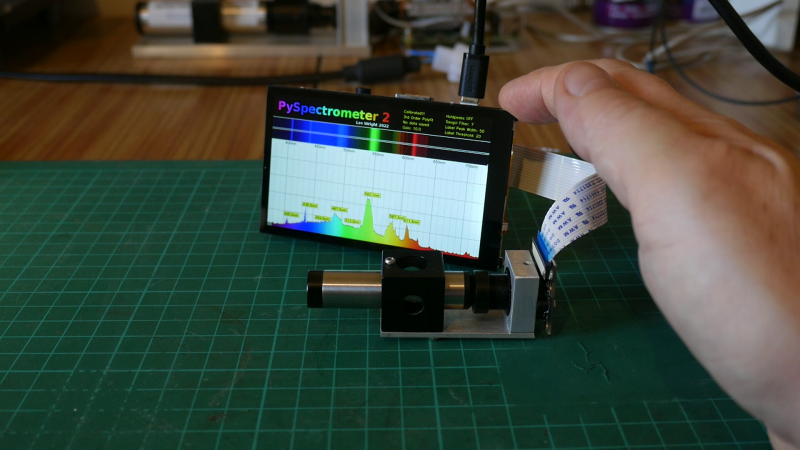
A low-cost benchtop spectroscope is coupled to a RaspberryPi Camera via a CCTV zoom lens and the whole setup is mounted to a small block of aluminium for thermal and mechanical stability. The spectroscope is pointed at a fluorescent lamp and the user is guided through a calibration routine to tune the software to the hardware.
We’re impressed with the precision [Les] has achieved with his builds, and the write-up is sufficiently detailed to allow others to follow in his footsteps. We’d love to see if readers build one themselves, and what they use them for!
If you want to read up on the original build, you can find our article here. We’ve covered several spectrometry projects in the past, including this Gamma-Ray Spectrometer and this one based around an STM32 Nucleo board.


What a nice build!
One thing I wonder about is the calibration method.
Why the manual clicking on specific peaks (inducing another ammount of uncertainty), if the software already knows the exact values of those peaks?
I think it should extract those values, present them to the user and let him enter the real values.
Or am I missing something crucial here?!
My guess would be that identifying the useful peaks is a non trivial problem for a computer to solve.
Not getting a computer to do it is one less thing that can go badly wrong. But someone could always submit a patch that uses an additional library to identify peaks (e.g. https://docs.scipy.org/doc/scipy/reference/generated/scipy.signal.find_peaks.html ).
But then you would probably need to fine tune the parameters which may change (break things) if you used a different diffraction grating spectroscope. There is a lot to be said for the “KISS principle”, especially for something that you do not need to do very often.
From the github README.md: “Future work:” – “I am thinking of implementing something approaching autocalibration, though this might be difficult implement for all use-cases.”
Damn, I knew I missed something. To be fair I didn’t read the whole readme :)
Thanks for the feedback!
The readme is a bit on the big side for sure!
The peaks are detected by peakdetect from peakutils, and in this iteration the labels have 1px wide “flagpoles” which make it easy to line up the crosshairs during calibration. It is possible to pull that array data, and just list them in the console without clicking, but I figured people probably wouldn’t want to fill out data for a dozen peaks, and working with the visual representation of the data is very usable as is.
That being said, if it seems more rational, I could pull the array, list the wavelengths that the software ‘thinks’ the peaks are and prompt for a new wavelength, but also allow the user to skip peaks of required.
Autocalibration is a “maybe” at the moment. In principle it is possible, but as ‘Truth’ pointed out it can be fraught with issues.
A couple of folk have requested a CIE1931 output window and this will find its way into a future build.
Neat! I want one!
Software looks nice. Not sure how good hardware really is. For testing/demo purposes it would nice to have assortment of “raw images” (or video) from multiple light sources/substances available somewhere. It would be also good way to benchmark how good “my system” is or will be if I decide to build one by myself.
I just made this simple “fake spectrum image” generator
https://github.com/hjkoskel/spectrumgen
Now it is possible to generate spectrums (.png or .mp4)
and evaluate py-spectrometer-2 with v4l2loopback and ffmpeg
@Dave Walker said: “We’d love to see if readers build one themselves, and what they use them for!”
I would like to at-least duplicate [LesWright]’s work. Initially my concern was the cost of the commercial diffraction grating spectroscope module. But after a little more study that was solved. From here:
https://github.com/leswright1977/PySpectrometer2
I see the commercial diffraction grating spectroscope module is here:
https://www.patonhawksley.com/product-page/benchtop-spectroscope
It costs £71.78 = $85.32 USD + Shipping. Not too bad. But now the biggest obstacle for me is finding an affordable Raspberry Pi. There are alternatives that might work out there though.