Article Text

Abstract
Objective To character the molecular landscape of patients with type 1 and type 2 SLE by analysing gene expression profiles from peripheral blood.
Methods Full transcriptomic RNA sequencing was carried out on whole blood samples from 18 subjects with SLE selected by the presence of manifestations typical of type 1 and type 2 SLE. The top 5000 row variance genes were analysed by Multiscale Embedded Gene Co-expression Network Analysis to generate gene co-expression modules that were functionally annotated and correlated with various demographic traits, clinical features and laboratory measures.
Results Expression of specific gene co-expression modules correlated with individual features of type 1 and type 2 SLE and also effectively segregated samples from patients with type 1 SLE from those with type 2 SLE. Unique type 1 SLE enrichment included interferon, monocytes, T cells, cell cycle and neurotransmitter pathways, whereas unique type 2 SLE enrichment included B cells and metabolic and neuromuscular pathways. Gene co-expression modules of patients with type 2 SLE were identified in subsets of previously reported patients with inactive SLE and idiopathic fibromyalgia (FM) and also identified subsets of patients with active SLE with a greater frequency of severe fatigue.
Conclusion Gene co-expression analysis successfully identified unique transcriptional patterns that segregate type 1 SLE from type 2 SLE and further identified type 2 molecular features in patients with inactive SLE or FM and with active SLE with severe fatigue.
- lupus erythematosus, systemic
- fibromyalgia
- autoimmune diseases
- inflammation
Data availability statement
Data are available in a public, open access repository. Raw data files have been deposited in NCBI accession PRJNA858861.
This is an open access article distributed in accordance with the Creative Commons Attribution Non Commercial (CC BY-NC 4.0) license, which permits others to distribute, remix, adapt, build upon this work non-commercially, and license their derivative works on different terms, provided the original work is properly cited, appropriate credit is given, any changes made indicated, and the use is non-commercial. See: http://creativecommons.org/licenses/by-nc/4.0/.
Statistics from Altmetric.com
WHAT IS ALREADY KNOWN ON THIS TOPIC
Pain and fatigue are frequent symptoms of SLE, but their relationship to inflammation is unknown.
A new construct has postulated that inflammatory manifestations on the one hand and pain and fatigue on the other are both manifestations of lupus and designated as type 1 and type 2 SLE.
WHAT THIS STUDY ADDS
Using gene expression analysis, the molecular bases of type 1 and type 2 SLE have been delineated.
Gene co-expression analysis not only separated type 1 and type 2 SLE, but also identified gene modules whose expression correlated with specific clinical features of type 1 and type 2 SLE.
HOW THIS STUDY MIGHT AFFECT RESEARCH, PRACTICE OR POLICY
The molecular pathways unique to patients with type 1 and type 2 SLE potentially could be used to confirm diagnosis and point to new treatment strategies.
Introduction
SLE is a prototypical autoimmune disease characterised by diverse clinical manifestations that vary in severity and intensity over time.1 Although deposition of immune complexes and the actions of type 1 interferon (IFN) can account for at least some manifestations of SLE, many of the symptoms that trouble patients the most, including fatigue and widespread pain, have an uncertain relationship to inflammation and immunological disturbance. Despite their frequency and impact on patients with SLE, these symptoms are not included in criteria for disease classification and are not represented in most measures of disease activity.2
A new conceptual framework for assessing SLE, which includes pain and fatigue, has been proposed.3 In this model, type 1 features, such as nephritis, arthritis and cutaneous SLE, are typically inflammatory in origin and can be associated with specific autoantibodies (eg, anti-DNA and nephritis). In contrast, type 2 manifestations include widespread pain, fatigue, depression, sleep disturbance and other neuropsychological findings such as ‘brain fog’. Because of the high frequency of these symptoms in SLE compared with the normal population,4 it has further been posited that type 2 features are intrinsic features of SLE and related to underlying pathogenesis, even if they might not track with inflammation. It is important to emphasise that signs and symptoms of SLE vary with time and treatment in individual patients, and those presenting with type 1 SLE may evolve into type 2 and vice versa and those with type 2 may have persistent or intermittent symptoms.3
Here, we have used a molecular approach to distinguish type 1 and type 2 SLE, testing the hypothesis that the two phases of SLE might arise from distinct pathogenetic disturbances that can be revealed by analysis of gene expression profiles in peripheral blood cells. For this purpose, we used a ‘bookend’ approach and identified patients with isolated type 1 and type 2 SLE. The data indicate that patients with type 1 and type 2 SLE can be distinguished by analysis of peripheral blood cell gene expression, with the pathways identified providing insights into the mechanisms of these manifestations and potentially pointing to new treatment targets.
Materials and methods
Patient population
All patients were enrolled in the Duke SLE Registry and were adults (≥18 years old) who met 1997 American College of Rheumatology or 2012 SLICC (Systemic Lupus International Collaborating Clinics) criteria for SLE (Systemic Lupus Erythematosus Disease).5 6 All patients signed informed consent to participate in the registry and for collection of the RNA samples. This was a cross-sectional analysis on a selected subset of 18 patients using a ‘bookend’ approach that specifically identified patients who had predominant type 1 or type 2 disease at the time of analysis. To be included in the type 1 SLE group, patients had a clinical SLEDAI (Systemic Lupus Erythematosus Disease Activity Index) ≥4, active nephritis, SLEDAI ≥6, or type 1 Physician Global Assessment (PGA) ≥1 and inactive type 2 SLE (defined as a Polysymptomatic Distress Scale (PSD) ≤6 and type 2 PGA ≤0.25). Patients with type 2 SLE had active type 2 SLE symptoms (defined as PSD ≥11 and type 2 PGA ≥1) and inactive type 1 SLE (defined as SLEDAI=0 and type 1 PGA ≤0.5).
Data collection
At the time blood was obtained for gene expression analysis, patients completed the PSD, which includes two subscales: the Widespread Pain Index (WPI) and Symptom Severity Score.7–10 In addition to patient-reported measures, patients’ treating rheumatologists completed disease activity measures, including the SLEDAI, PGA for type 1 activity and a PGA for type 2 activity2 11 12; rheumatologists scored the severity of type 1 and type 2 SLE activity separately on scales from 0 (no activity) to 3 (severe activity) (online supplemental tables 1 and 2).
Supplemental material
Supplemental material
Gene expression data and gene filtering
Whole blood was collected in PAXgene Blood RNA tubes. After removal of ribosomal RNA and globin transcripts with the Ribo-Zero Globin Removal kit (Illumina), stranded libraries were prepared with the TruSeq Library prep kit (Illumina) and hybridised to a flow cell for sequencing with the Illumina HiSeq platform. The top 5000 row variance (top5k rowVar) genes determined using SD between samples were retained for further analysis. Data were analysed for differentially expressed genes (DEGs), for subset clustering by Principal Component Analysis (PCA), and for co-expressed genes using Multiscale Embedded Gene Co-expression Network Analysis (MEGENA)13 as described in online supplemental methods. Gene expression data from patients with fibromyalgia (FM) were obtained from GSE6731114 and analysed as described in the online supplemental methods. Gene expression data from patients with inactive SLE (SLEDAI <6) were obtained from GSE4529115 and GSE49454.16 Gene expression data from patients with active SLE were obtained from GSE88884 (Illuminate 2). Raw data files have been deposited in NCBI accession PRJNA858861.
Supplemental material
Results
Patients
Patients had been diagnosed with SLE for a mean of 15.8 years (SD: 7.3) and 55% had a history of SLE nephritis. Seventeen patients were female and one was male; the mean patient age was 41 years (online supplemental figure 1A).
Supplemental material
PCA groups patients with type 1 and type 2 SLE
Initially, we determined that differential gene expression analysis generated only one significant DEG, likely because of the high variance patterns within the two sample sets rather than between them. Therefore, additional analytical approaches were applied to the top5k rowVar genes encoding known proteins. PCA generally separated samples from type 1 and type 2 SLE, although three outliers were clearly noted (patient IDs Type1_275, Type2_008 and Type2_267 (red arrows, online supplemental figure 1B). To obtain a preliminary idea of the clinical features segregating with the samples in PCA space, the first four principal component (PC) vectors were correlated with the various recorded sample traits and the top 20 positive or negative correlations per PCA visualised (online supplemental figure 1C). Of note, PC1 highly correlated with anti-dsDNA, belimumab and mycophenolate mofetil usage, PC2 to non-steroidal anti-inflammatory drug usage, African ancestry, anti-Smith and anti-RNP, PC3 to cyclophosphamide and amitriptyline usage, and PC4 to PSD score and total areas of pain. These results suggest that type 1 and type 2 SLE are largely but not completely separable based on gene expression variance, and that specific clinical characteristics segregate with gene expression variance patterns.
Gene co-expression analysis identifies distinct type 1 and type 2 gene modules
Gene co-expression analysis was next employed to delineate transcriptomic differences between type 1 and type 2 SLE in greater detail. MEGENA, an analytical technique not previously employed with samples from patients with SLE, was used to generate co-expression modules from the top5k rowVar genes of the SLE samples (online supplemental figure 2).
Supplemental material
To determine the correlation of co-expression modules with clinical features, the module eigengene (ME) of each module was calculated and correlated with the various recorded clinical and demographic traits (online supplemental table 3). Associations between MEs of specific co-expression modules and select clinical and demographic features are shown in figure 1A–I. The functional nature of co-expression modules was identified by examining genes in each module for overlap with gene modules identifying specific cells or functions in figure 1J–L.
Supplemental material

Correlations of MEGENA module expression and various clinical and demographic features. The module eigengene (ME, equivalent to the first principal component) for each module was calculated and Pearson correlations to MEs calculated for multiple demographic and clinical features with correlations ranging from −1 to +1 (A–I). Functional identity of the modules was carried out by matching module genes with various cell type or biological pathway markers (J–L). Functional designation required a minimum overlap of ≥3 gene symbols with an associated Fisher’s exact test (p<0.2) to discard overlaps that occurred because of random chance. AA, African ancestry; EA, European ancestry; IFN, interferon; MEGENA, Multiscale Embedded Gene Co-expression Network Analysis; NK, natural killer; PGA, Physician Global Assessment; PSD, Polysymptomatic Distress Scale.
The top 40 positive or negative ME correlations correlated with type 1/2 SLE cohort were identified and submitted to stable k-means clustering that revealed groupings of clinical traits and correlated molecular functions (figure 2). Most type 2 features, including PSD score, PGA type 2, wake unrefreshed, WPI score and tired among others were found in the first vertical patient column cluster 1, whereas type 1 features, including SLEDAI, anti-dsDNA, proteinuria and European Alliance of Associations for Rheumatology score among others were found in patient cluster 2. Patient cluster 1 showed strong positive correlations to the horizontal module clusters A, E and G, containing various metabolic pathway signatures and B cells. The type 1 patient cluster 2 showed strong positive correlations to horizontal module clusters B, C, D and F signatures including monocytes, IFN, T cells, neutrophils, cell cycle and other signatures. An alternative depiction of the top 40 intracorrelations is provided in online supplemental figure 3, and correlation pairs of select patient clinical scores and molecular assays in online supplemental figure 4.
Supplemental material
Supplemental material
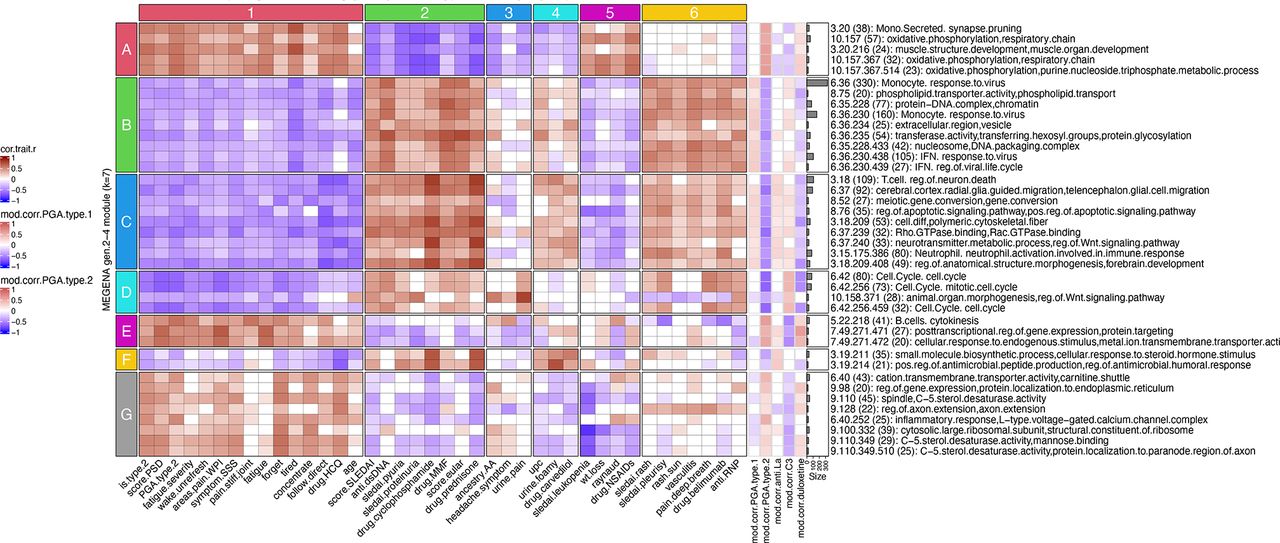
MEGENA module eigengene (ME) correlations to clinical and demographic features reveal specific gene modules associated with individual clinical characteristics of type 1 and type 2 SLE. Numerically encoded sample/patient traits were correlated with the first principal component (equivalent to the ME) of all gen2 through gen4 MEGENA modules followed by identification of the top 40 significant (p<0.05) correlations to cohort (type 1 SLE vs type 2 SLE). The top 40 sample trait correlations were identified by descending rank order of absolute values of the summed correlations per each module row and are shown in the main heatmap portion of the figure. In the right portion of the figure, row annotations are shown for sample traits that were not included in the top 40 correlations, but are of clinical interest. These include ME correlations to PGA for type 1 SLE, PGA for type 2 SLE (seen in the central heatmap of the figure but repeated on the right side for ease of visual comparison), autoantibodies anti-La/SSB, low C3 and usage of duloxetine. AA, African ancestry; EULAR, European Alliance of Associations for Rheumatology; HCQ, hydroxychloroquine; IFN, interferon; MEGENA, Multiscale Embedded Gene Co-expression Network Analysis; NSAIDs, non-steroidal anti-inflammatory drugs; PGA, Physician Global Assessment; PSD, Polysymptomatic Distress Scale; SSS, Symptom Severity Score; UPC, Urine Protein Creatinine Ratio; WPI, Widespread Pain Index.
Because there was a numerical but not significant disparity in age between the groups (type 1, 36.9±10.8; type 2, 46.0±8.7, p=0.07), we carried out two additional analyses to confirm that age was not contributing to the results. First, we eliminated the two youngest patients from the type 1 group and the two oldest from the type 2 group and repeated the analysis, resulting in a very similar separation of clinical features (online supplemental figure 5). Second, we used the entire group of patients and carried out the same analysis after covariant adjustment for age, again with similar results (online supplemental figure 6). These results are all consistent with the conclusion that expression of co-expression modules is uniquely correlated with specific features of type 1 and type 2 SLE independent of age.
Supplemental material
Supplemental material
Protein–protein interaction analysis identifies biological function of co-expression modules
To provide insight into the biological functions of genes within co-expression modules, we assessed genes within the top 40 MEGENA modules for protein–protein interactions (PPIs) using the STRING database.17 We found that 34 of the top 40 co-expression modules contained genes that were intraconnected by known PPIs, with 25 exhibiting 10%–50% and 5 having >50% PPI intraconnectedness (online supplemental table 4). This finding confirms that the co-expression modules have captured known molecular pathways in an unsupervised manner. Type 1 SLE PPI intraconnected modules included cell cycle, T cells, regulation of neuronal death, extracellular region/vesicles, IFN and monocytes. Type 2 SLE PPI intraconnected modules included monocyte secretion, cation transport, axon extension, muscle structure development and the inflammatory response/voltage-gated calcium channel complexes. PPI connectedness is included as module row annotations in figures 3 and 4.
Supplemental material

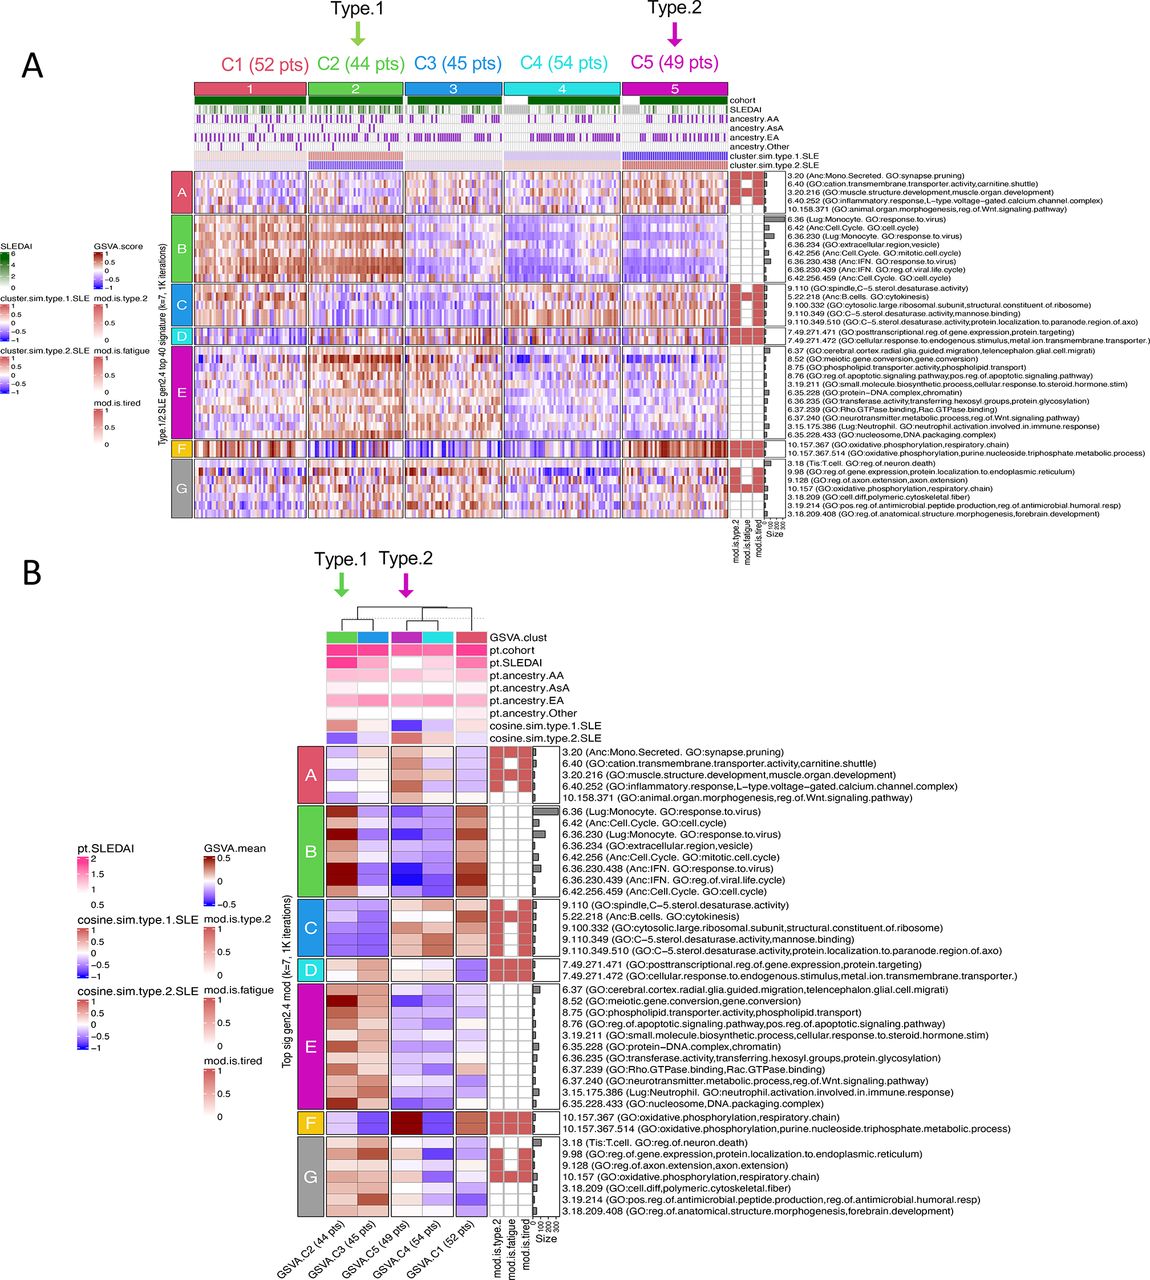
Clustering patient samples based on module eigengene (ME) separates type 1 SLE from type 2 SLE. The top 40 significant (p<0.05) type 1/2 SLE gen2–4 cohort MEs were used to group patients using stable k-means clustering (k=2). Patient column annotations include patient type (type.1.SLE white, type.2.SLE red), areas of pain as measured by the Widespread Pain Index (WPI), Symptom Severity Score (SSS), PSD score, PGA for type 1 or type 2 SLE, SLEDAI score (with lab), ACR-EULAR score, autoantibodies (anti-dsDNA, anti-LA/SSB, anti-RNP/SSA, anti-Smith), low C3 (binary), ancestral background (AA and EA), prednisone dosage, and usage of MMF or duloxetine (binary). Columns of sample traits were clustered using stable k-means clustering (k=2) with 1000 iterations. Module rows were clustered in a similar manner on k=7 and include correlations to patient traits (−1 blue to +1 red), percentage of a given module’s genes participation in predicted protein–protein interactions per STRING analysis and degree of module preservation in GSE67311 classic fibromyalgia. Patients type1 275 and type2 267 (red arrows) correspond to the same outliers identified during PCA in online supplemental figure 1 (A). Data from (A) were plotted as a mean of the patients in each cluster (B). Column annotations are means of column annotations in (A) and row annotations are identical to row annotations in (A). AA, African ancestry; ACR, American College of Rheumatology; EA, European ancestry; EULAR, European Alliance of Associations for Rheumatology; IFN, interferon; MMF, mycophenolate mofetil; PCA, Principal Component Analysis; PGA, Physician Global Assessment; PSD, Polysymptomatic Distress Scale.

GSVA using MEGENA modules as input gene sets effectively separates type 1 SLE from type 2 SLE. Heatmaps indicate GSVA enrichment scores per patient for each module. Patient column annotations include patient type (type.1.SLE white, type.2.SLE red), areas of pain as measured by the Widespread Pain Index (WPI), Symptom Severity Score (SSS), PSD score, PGA for type 1 or type 2 SLE, SLEDAI score (with lab), ACR-EULAR score, autoantibodies (anti-dsDNA, anti-LA/SSB, anti-RNP/SSA, anti-Smith), low C3 (binary), ancestral background (AA and EA), prednisone dosage and usage of MMF or duloxetine (binary). Columns of sample traits were clustered using stable k-means clustering (k=2) with 1000 iterations. Module rows were clustered in a similar manner on k=7 and include correlations to patient traits (−1 blue to +1 red), percentage of a given module’s genes participation in predicted protein–protein interactions per STRING analysis and degree of module preservation in GSE67311 classic fibromyalgia. Patients type1 275 and type2 267 (red arrows) correspond to outliers identified during PCA analysis in online supplemental figure 1 (A). Data from A were plotted as a mean of the patients in each cluster (B). Column annotations are means of column annotations in (A) and row annotations are identical to row annotations in (A). AA, African ancestry; ACR, American College of Rheumatology; EA, European ancestry; EULAR, European Alliance of Associations for Rheumatology; GSVA, Gene Set Variation Analysis; IFN, interferon; MEGENA, Multiscale Embedded Gene Co-expression Network Analysis; MMF, mycophenolate mofetil; PCA, Principal Component Analysis; PGA, Physician Global Assessment; PSD, Polysymptomatic Distress Scale.
Gene co-expression modules distinguish type 1 and type 2 SLE
Stable k-means clustering of co-expression module MEs was used to determine whether type 1 and type 2 SLE patient samples could be distinguished. Effective separation of patients with type 1 and type 2 SLE was achieved, with only two outliers (Type1_275 and Type2_267) noted (figure 3). Unique patterns of co-expression module MEs and type 1 and type 2 SLE, respectively, can clearly be seen. Moreover, unique and opposing co-expression module ME correlations with SLEDAI and PSD scores or PGA type 2 were found. Notably, MEs of co-expression modules identifying the IFN signature and monocytes were highly positively correlated with SLEDAI and negatively correlated with PSD score. Conversely, the MEs of the axon extension, muscle structure development and B cell modules were negatively correlated with SLEDAI and positively with PSD score. Finally, patient ancestry also was correlated with specific co-expression module MEs. The detailed correlations between the coefficients of specific gene module expression and clinical traits are shown in online supplemental figures 3 and 4 and confirm the largely mutually exclusive relationship between co-expression module expression and type 1 or type 2 features.
Gene co-expression modules distinguish type 1 and type 2 SLE using Gene Set Variation Analysis
To confirm this finding in an orthogonal manner, we used Gene Set Variation Analysis (GSVA) using co-expression modules as input gene sets followed by stable k-means clustering of GSVA scores. This approach also effectively distinguished patients with type 1 and type 2 SLE (figure 4).
DEG pairs distinguish type 1 and type 2 SLE samples
We employed Differential Gene Coexpression Analysis (DGCA)18 as a complementary method to distinguish patients with active type 1 or type 2 SLE symptoms in greater detail. Here, DGCA was used to detect intermodular pairs of genes as a way to delineate potential differences between the molecular communication inherent in type 1 and type 2 SLE pathology. As seen in online supplemental figure 7 and online supplemental tables 5 and 6, top unique intermodular connections distinguished patients with type 1 SLE from those with type 2 SLE. Patients with type 1 SLE were remarkable for neutrophil involvement/cell activation immune response and monocytes and patients with type 2 SLE largely for B cell interactions.
Supplemental material
Supplemental material
Supplemental material
Co-expression module preservation between type 1 and type 2 SLE and FM samples
Next, we sought to determine the relationship between the co-expression modules used to distinguish type 1 and type 2 SLE and those generated from a dataset of classic FM (GSE67311). MEGENA was employed to generate co-expression modules from the 70 FM patient samples in this dataset, and the MEs of the top 40 modules correlating with the seven clinical traits (bipolar disorder, body mass index, chronic fatigue syndrome, Fibromyalgia Impact Questionnaire Score, irritable bowel syndrome, migraine, major depression) were visualised (online supplemental figure 8A). Module preservation was then carried out between the type 1 and type 2 SLE co-expression modules and those generated from GSE67311 FM samples. Using a composite z summary score (online supplemental figure 8B), 40 of the 157 type 1 and type 2 SLE modules were preserved (z score >2), 29 were moderately preserved (z score >5) and 21 were well preserved (z score >10) among the FM co-expression modules. Functional annotations of top preserved modules showed immune/inflammatory cells, including monocytes, T cells, neutrophils, functional activities, including interleukin (IL)-1, cytokines, MHC binding and IFN, and also glial cell migration and axon guidance (online supplemental table 7). The degree of module preservation in GSE67311 patients is included as module row annotations in figures 3 and 4.
Supplemental material
Supplemental material
GSVA further distinguishes patients with type 1 and type 2 SLE and identifies a subset of FM
We next assessed in greater detail the relationship between SLE gene expression abnormalities and those in FM. For this purpose, we used stable k-means clustering of GSVA scores to generate five distinct FM patient clusters (figure 5). Notably, a subset of patients with idiopathic FM (18 of 45, 40%) molecularly resembled type 2 SLE patient signatures (patients within vertical clusters 1 and 3), and ‘fatigue’ and ‘tired’ type 2 SLE modules were highly correlated with this patient subset. Co-expression modules included strong correlations in opposing directions with patients with type 1 SLE versus type 2 SLE symptoms. Patients with type 1-like FM were notably and positively correlated with the horizontal module clusters A, C and D that included monocytes, IFN, T cells, cell cycle, neutrophils and neurotransmitter processes. Patients with type 2-like FM were notably and positively correlated with the horizontal module clusters E, G and H that included metabolic pathways, muscle structure development, B cells and L-type voltage-gated calcium channel complexes.

Type 1/2 SLE molecular signatures identify 18 of 45 (40%) subjects with fibromyalgia (FM) from GSE67311 exhibiting enrichment of type 2 gene modules. The top5k rowVar genes from GSE67311 were analysed by GSVA using the top 40 type 1/2 SLE cohort gen2–4 modules as gene signatures. Column annotations include FIQR (Fibromyalgia Impact Questionnaire Score), BMI (body mass index), CFS (chronic fatigue syndrome), major depression (yes/no), migraine (yes/no), IBS (irritable bowel syndrome, yes/no), and mean cluster cosine similarity to bona fide type 1 and type 2 sample results. FM patient cluster 2 (12 patients) is most similar (cosine sim >0.3) to type 1 SLE signatures, and FM patient clusters 1 (10 patients) and 3 (8 patients) are most similar to type 2 SLE signatures. Clusters 4 and 5 had only weak similarity to type 1 or type 2 SLE (sim <0.3). Row annotations indicate modules that were significantly correlated with type 1 SLE or type 2 SLE, fatigue and tired. Columns were stably clustered (1000 iterations) into k=5 patient clusters and rows optimally clustered into k=8 groups of modules (A). GSVA enrichment score row means and sample traits were calculated for the five GSVA patient clusters (B). GSVA, Gene Set Variation Analysis; IFN, interferon.
Type 1 and 2 SLE modules identify a subset of patients with inactive SLE
We next determined whether patients with the type 2 SLE signature could be found in other datasets of patients (GSE45291 and GSE49454) with inactive SLE (SLEDAI <6). Stable k-means clustering based on GSVA scores using the type 1 and type 2 SLE co-expression clusters formed four distinct groups within each study. In GSE45291, most patients with inactive SLE (151 of 244, 61.8%) were not identified by GSVA using type 1 and type 2 co-expression modules as gene sets. However, 49 of 244 (20.1%) patients with inactive SLE were identified by enrichment of the type 2 co-expression modules (figure 6). Notably, a similar number (44 of 244, 18%) were identified by enrichment of the type 1 gene signature. Similar results were seen in patients with inactive SLE in GSE49454 (online supplemental figure 9). These results indicate that most patients with inactive SLE do not express either the type 1 or type 2 gene expression signature. However, small subsets express one or the other, suggesting that a small proportion of each may have the molecular profile of type 1 and type 2 SLE. A summary of the distribution of patients with inactive SLE and FM showing molecular features of type 1 and type 2 SLE is shown in online supplemental figure 10. Unfortunately, clinical features of type 2 SLE are not available in these datasets.
Supplemental material
Supplemental material

Type 1/2 SLE molecular signatures identify a small subset of 49 of 244 (20.0%) subjects with inactive SLE (SLEDAI <6) from GSE45291 exhibiting enrichment of type 2 gene modules. The top5k rowVar genes from GSE45291 were analysed by GSVA using the top 40 type 1/2 SLE cohort gen2–4 modules as gene signatures. Column annotations include cohort (healthy or SLE), SLEDAI score and ancestral background (AA, AsA, EA and other), and mean cluster cosine similarity to bona fide type 1 and type 2 sample results. Inactive SLE patient cluster 2 (44 patients) is most similar to type 1 SLE signatures and inactive SLE patient cluster 5 (49 patients) is most similar to type 2 SLE signatures. Clusters 1, 3 and 4 had only weak similarities to type 1 or type 2 SLE (sim <0.3). Row annotations indicate modules that were significantly correlated with type 2 SLE, fatigue and tired. Columns were stably clustered (1000 iterations) into k=5 patient clusters and rows optimally clustered into k=7 groups of modules (A). Mean GSVA enrichment scores and sample traits were calculated for the five GSVA patient clusters (B). AA, African ancestry; AsA, Asian ancestry, EA, European ancestry; GSVA, Gene Set Variation Analysis; IFN, interferon.
SLE subsets identified by type 2 SLE gene modules have severe fatigue more frequently
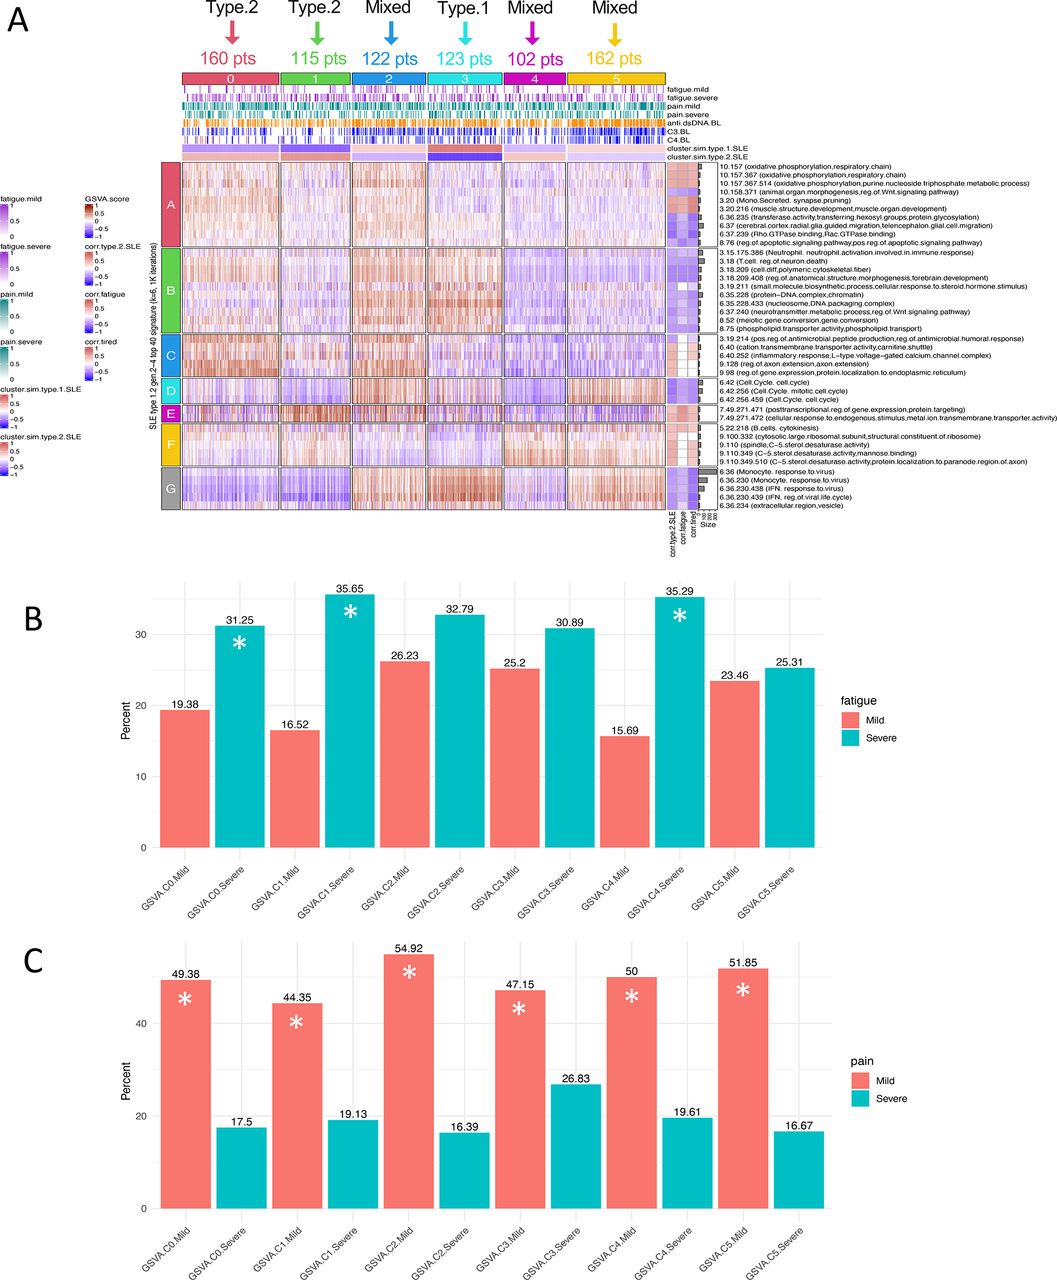
Finally, we sought to determine whether subsets of patients with SLE identified by enrichment of type 2 SLE modules have a greater frequency of severe fatigue. We employed GSE88884 (Illuminate 2) for this analysis even though this dataset was limited to patients with active disease (SLEDAI of 6 or more) because fatigue and pain were measured, although using different metrics (Brief Fatigue Inventory and Brief Pain Inventory). As can be seen in figure 7, using k-means clustering based on enrichment of the 40 SLE type 1 and type 2 co-expression modules and GSVA, GSE88884 samples were separated into six subsets, two with similarity to type 2 SLE, one with similarity to type 1 SLE and three with mixed features. When these subsets were interrogated for the frequency of severe fatigue, the two type 2-like subsets were significantly enriched for patients with severe fatigue along with one of the mixed subsets. Further analysis of this mixed subset indicated minimal or no enrichment of the horizontal module cluster G containing monocyte and IFN signatures. It is notable that all subsets contained significantly more patients with mild pain with no differences between the subsets.

Analysis of patients with active SLE (GSE88884) identifies patient groups with severe fatigue. GSVA was carried out on GSE88884 (Illuminate 2) using the top 40 type 1/2 SLE cohort modules as signatures. Stable k–means clustering of GSVA enrichment scores formed six patient clusters and six module clusters. Column annotations include mild or severe fatigue (mild 1–3, severe 8–10) using the Brief Fatigue Inventory, mild or severe pain scored using the Brief Pain Inventory (mild 1–4, severe 7–10), anti-dsDNA, C3 and C4 at baseline (low −1, normal 0, high +1), and mean cluster cosine similarity to the type 1 SLE and type 2 SLE patient clusters. Illuminate 2 patient cluster 3 was most similar by cosine similarity to type 1 SLE signatures, and clusters 0 and 1 were most similar to type 2 SLE signatures. Clusters 2, 4 and 5 were mixed (type.2.SLE cosine similarities −0.34, +0.36 and −0.23, respectively). Row annotations indicate modules that were significantly correlated with type 1/2 SLE, fatigue and tired (A). Proportion test analysis significantly (p<0.05) identifies Illuminate 2 patient groups with fatigue by the Brief Fatigue Inventory (mild 1–3, severe 8–10) (B) and those with pain scored using the Brief Pain Inventory (mild 1–4, severe 7–10) (C). Patient clusters marked as (*) exhibit a significant difference between the frequency of severe and mild fatigue or pain, respectively. GSVA, Gene Set Variation Analysis; IFN, interferon.
Discussion
In this pilot study using a bookend approach, we tested the hypothesis that patients with SLE with high levels of type 1 or type 2 symptomatology can be distinguished on the basis of transcriptomic analysis of peripheral blood cells. While the number of patients in this study was limited, the data nevertheless support five important conclusions concerning type 1 and type 2 SLE activity. First, co-expression gene modules derived from patients with type 1 and type 2 SLE highly correlate with specific features of type 1 and type 2 SLE. Second, patients with active type 1 or type 2 SLE have quite distinct gene expression profiles, with perturbations of specific molecular pathways. Third, the type 1 and type 2 SLE-related gene expression profiles can identify unique subsets of patients with FM. Fourth, the gene expression profiles of type 2 SLE can be detected in unrelated datasets comprised of patients with inactive SLE. Finally, the type 2 SLE gene co-expression modules identify subsets of patients with active SLE with a greater frequency of severe fatigue.
Previous studies of peripheral blood cells have primarily addressed the relationship of changes in gene expression to inflammatory disease activity as measured by instruments such as the SLEDAI.19 These studies have thus focused largely on type 1 disease. This raises the question of whether the differences in gene expression profiles merely are indicative of differences in disease activity. A number of studies have assessed gene expression changes related to changes in disease activity measured by SLEDAI. Although changes have been identified in different studies,20 no consensus pattern of gene expression d.21 Moreover, in this study, the type 2 gene expression profile was seen in only a small fraction of inactive patients in two datasets and also in a subset of patients with SLE with active disease. Therefore, it is unlikely that the type 2 gene expression profile merely reflects changes in SLEDAI score. In this regard, association of the IFN gene signature with type 1 SLE is notable. In general, the IFN signature is associated with the diagnosis of SLE, but may not change significantly over time in longitudinal studies of adult patients with disease activity in individual paediatric patients.22–24 Of note, recent studies have revealed a significant association between the IFN signature and the presence of specific autoantibodies, especially those to RNA-binding nuclear proteins, including anti-RNP, anti-Sm and anti-SSA.25 Notably, administration of type 1 IFN as a treatment can cause symptoms consistent with type 2 SLE activity, including fatigue and achiness.26 In the current study, an association was found between the IFN gene signature and type 1 but not type 2 SLE activity. These results clearly establish an association between the IFN signature and type 1 SLE, consistent with the role of both IFN and autoantibodies in the inflammatory features of SLE, similar to results reported here.27
Beyond the IFN gene signature, expression of other specific gene modules was shown to be useful in distinguishing type 1 and type 2 SLE activity. These findings were validated using a number of orthogonal analytical techniques, including ME correlations, GSVA enrichment scores and analysis of DGCA intermodular pairings. Unique type 1 SLE gene module enrichment included monocytes, neutrophils, T cells, IFN, IL-1, tumour necrosis factor (TNF), cell cycle and Wnt signalling, all characteristic of the inflammatory nature of this form of SLE. DGCA more specifically implicated type 1 SLE interactions between monocytes and neutrophils and a host of other neutrophil interactions, notably including IL-1 and IFN. DGCA also showed that cell cycle was paired with the generation of superoxide and hydrogen peroxide as part of the neutrophil innate immune response, steroid precursor generation for manufacture of many molecules including immune signals, and T cell and Fc receptor activity. These features are all typical of the inflammatory nature of type 1 SLE symptoms as previously reported for active SLE in general.1
In contrast to findings with type 1 SLE, expression of a number of other gene modules characterised active type 2 SLE symptoms. We found a number of neural features that distinguished type 1 and type 2 SLE activity. Unique type 1 SLE module enrichment included those annotated as cerebral cortex microglial cell migration and neurotransmitter metabolism. DGCA more specifically suggested type 1 SLE intermodular connections between neutrophils and neurotransmitter metabolism, postsynaptic endosomes and nervous system development. It was initially surprising in this study of peripheral blood that one module was annotated as microglia rather than monocytes/macrophages. Although these cell types share no common progenitor, they are both members of the mononuclear phagocyte system and share functional features which could lead to overlaps in cell type annotations. Additional studies will be necessary to determine whether enrichment of this module reflects microglial or general monocyte/macrophage enrichment in type 1 SLE, but this enrichment is consistent with previous studies on the contribution of mononuclear phagocyte activity to inflammatory features of SLE.28–30
It is also of interest that type 1 SLE activity was associated with a neutrophil signature. Previous studies have clearly delineated a role of neutrophil subpopulations in active SLE31 32 and, notably, in this study, this association was only found in patients with active type 1 and not type 2 SLE. In addition, steroid usage was positively correlated with neutrophils, monocytes, IL-1 and the Fc receptor in type 1, but these features were all negatively correlated with type 2 SLE. This finding implies that neutrophils may contribute to the features of type 1 but not type 2 SLE, although steroid administration is a possible contributor.21 22 33
Type 2 SLE was also notable for neuromuscular and metabolism enrichment, sufficiently distinct to be detected in peripheral blood. These findings include muscle structure development, oxidative phosphorylation, cation transport, the carnitine shuttle (concentrated in skeletal and cardiac muscle) and L-type voltage-gated calcium channel complexes (which are associated with skeletal, smooth and cardiac muscle). Mitochondrial dysfunction and homeostatic imbalance have been investigated in FM as potentially modulating neuropathic pain through links with energy metabolism34 including mitochondrial abnormalities in carnitine fatty acid metabolism.35 It has been suggested that there is a connection between reactive oxygen species and neuropathic pain and that mitochondria could be a therapeutic target in FM and may also be involved in sensitivity to painful stimuli in type 2 SLE.36 37
Besides identifying gene expression modules that discriminate type 1 from type 2 SLE, we identified patient clusters derived from two studies of patients with inactive SLE who shared some transcriptional patterns with those we found with type 2 SLE. Only a small fraction of patients with inactive SLE were enriched for the type 2 gene signature (20.1%–34.6%). Because we did not have information on type 2 symptoms in these patients, we went on to analyse patients from a clinical trial (GSE88884, Illuminate 2) because fatigue and pain were recorded, even though all of these patients manifested active disease (SLEDAI ≥6). It is notable that an increased frequency of severe fatigue was found in the subsets with type 2 gene expression features and even in a subset with mixed molecular features but diminished type 1 monocyte and IFN gene expression. It was surprising that no difference in the frequency of severe pain was noted in the subsets, but this could relate to differences in the information collected by the WPI versus the Brief Pain Inventory.
Our study is the first attempt to assess differences in gene expression in patients who have been selected to have primarily type 1 SLE or type 2 SLE at the time of analysis, a so-called bookend approach. All patients with current type 2 SLE activity have had active type 1 SLE in the past, as type 1 activity is required to meet criteria for SLE.5 6 It is, therefore, interesting to speculate that type 1 and type 2 symptoms may vary in individual patients with SLE and gene expression profiling may be useful to delineate or possibly even predict the transition. It is also possible that type 1 and type 2 symptoms may coexist in some patients as fatigue, for example, is present in as many as 90% of all patients with SLE, and that gene expression profiling might be useful in dissecting the molecular endotype of each set of manifestations. The preliminary analysis of patients with active SLE supports this conclusion.
Our study also indicates a relationship between transcriptional patterns in type 2 SLE and a subset of patients with FM, including enrichment of B cells, plasma cells and IgG chains as identified using DGCA. Since many factors can lead to central sensitisation, a key postulated mechanism for FM, it is not surprising that there is heterogeneity in the transcriptional profiles. The observation of common features in a subset of FM is, therefore, notable and suggests that despite diversity of causative factors for central sensitisation, common transcriptional changes can occur whether FM occurs by itself or in the context of an inflammatory disease.
It is also of interest that a second subset of FM had a gene expression profile similar to that of type 1 SLE. Notably, this subset had additional gene expression features of inflammation, including enrichment of monocytes, inhibitory macrophages, neutrophils, as well as IFN, TNF and IL-1 pathways. Unfortunately, detailed clinical evaluations of these patients are not available to determine whether they did indeed have underlying inflammatory disease. Despite this uncertainty, the data suggest that gene expression profiling can distinguish subsets of FM, two of which are molecularly similar to type 2 SLE, and a second with more inflammatory features typical of type 1 SLE.
As a pilot study, the current study has limitations. The number of patients is relatively small. Moreover, we did not have detailed clinical information about subjects with FM or inactive SLE. Finally, we did not have the opportunity to follow patients longitudinally to determine whether molecular features track with or even precede clinical features of type 1 and type 2 SLE. Despite this, the results are provocative and merit confirmation in larger datasets.
In summary, our study used a number of orthogonal bioinformatics approaches to distinguish type 1 from type 2 SLE based on unique transcriptional patterns. Additionally, we identified a subset of patients with type 2-like SLE in datasets of FM and inactive SLE, suggesting molecular similarities of these entities. Moreover, we could identify a subset of patients with active SLE who expressed the type 2 gene expression profile and exhibited an increased frequency of severe fatigue. Finally, we found that a subset of patients with FM showed molecular features of type 1 SLE with upregulation of many inflammatory genes; these findings suggest the possibility of inflammatory components in some patients with idiopathic FM.
Data availability statement
Data are available in a public, open access repository. Raw data files have been deposited in NCBI accession PRJNA858861.
Ethics statements
Patient consent for publication
Ethics approval
All patients signed informed consent to participate in the registry and for collection of the RNA samples (Duke Health IRB Pro00008875). This was a cross-sectional analysis on a selected subset of 18 patients (Duke Health IRB Pro00094645).
References
Supplementary materials
Supplementary Data
This web only file has been produced by the BMJ Publishing Group from an electronic file supplied by the author(s) and has not been edited for content.
- Data supplement 1
- Data supplement 2
- Data supplement 3
- Data supplement 4
- Data supplement 5
- Data supplement 6
- Data supplement 7
- Data supplement 8
- Data supplement 9
- Data supplement 10
- Data supplement 11
- Data supplement 12
- Data supplement 13
- Data supplement 14
- Data supplement 15
- Data supplement 16
- Data supplement 17
- Data supplement 18
Footnotes
Twitter @RobertDRobl
Contributors Substantial contributions to the conception or design of the work—RR, MC, PSB, AE, JLR, DP and PL. Drafting the work or revising it critically for important intellectual content—RR, MC, PSB, AE, JLR, DP and PL. Final approval of the version of the article to be published—RR, MC, PSB, AE, JLR, DP and PL. Agreement to be accountable and as guarantors for all aspects of the work—RR, MC, PSB, AE, JLR, DP and PL.
Funding The authors have not declared a specific grant for this research from any funding agency in the public, commercial or not-for-profit sectors.
Competing interests None declared.
Patient and public involvement Patients and/or the public were not involved in the design, or conduct, or reporting, or dissemination plans of this research.
Provenance and peer review Not commissioned; externally peer reviewed.
Supplemental material This content has been supplied by the author(s). It has not been vetted by BMJ Publishing Group Limited (BMJ) and may not have been peer-reviewed. Any opinions or recommendations discussed are solely those of the author(s) and are not endorsed by BMJ. BMJ disclaims all liability and responsibility arising from any reliance placed on the content. Where the content includes any translated material, BMJ does not warrant the accuracy and reliability of the translations (including but not limited to local regulations, clinical guidelines, terminology, drug names and drug dosages), and is not responsible for any error and/or omissions arising from translation and adaptation or otherwise.