When working with anything digital, you’re going to end up reading or writing a timing diagram before long. For us, that’s meant keeping (text) notes, drawing something on a napkin, or using a tool like Inkscape. None of these are ideal.
An afternoon’s search for a better tool ended up with Wavedrom.
Just so you know where we’re coming from, here’s our list of desiderata for a timing diagram drawing solution:
- Diagrams have a text-based representation, so their generation can be easily scripted and the results versioned and tracked throughout project development
- Command-line rendering of images, because we like to automate everything
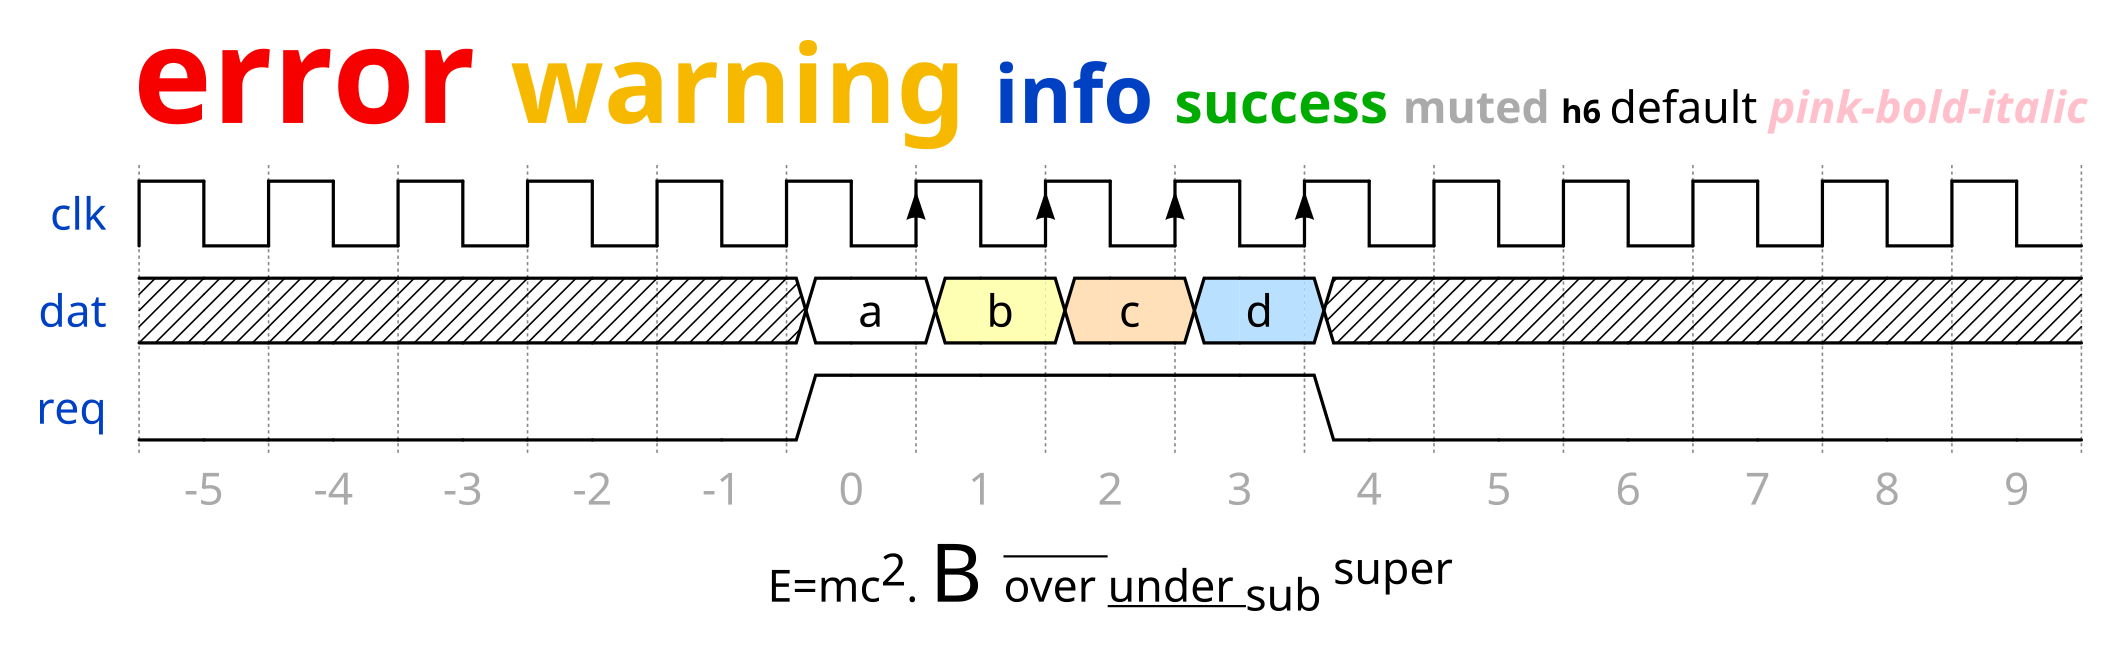
- Looks good
- Simple to use for common cases, but flexible enough to do some strange stuff when needed
- Output modifiable when absolutely necessary: SVG would be nice
Basically, what we want is graphviz for timing diagrams.
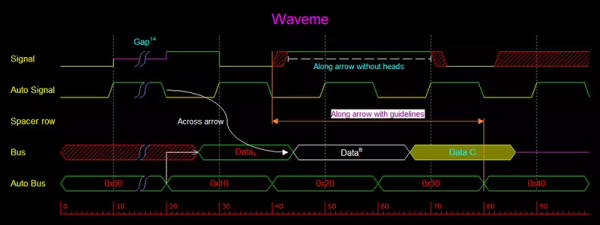
Wavedrom nails four out of these five at the moment, and has promise to cover all of the bases. Give the online editor demo a try. We found it intuitive enough that we could make simple diagrams without even reading the fine manual. The tutorial has got you covered for more esoteric use cases.

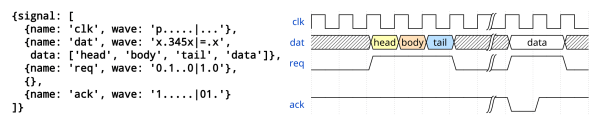
Clearly, some good thought has been put into the waveform description language, WaveJSON; it’s mostly readable and makes the essentials quick and easy. Because you can also enter straight SVG, it leaves the door open for full-fledged lunacy.
Wavedrom is written in JavaScript, and built for embedding in webpages; that’s the way they intend us to use it. On the other hand, if you want to run your own local version of the online editor, you can download it and install it locally if you’d like.
Our only quibble is that the standalone, command-line application wouldn’t generate images without the GUI on our Arch system. (Looks like there are some Google Chrome dependencies?) Otherwise, we think we’ve found our solution.
There are other applications out there. Drawtiming looks good, but we can’t quite get our head around the file format and the graphic output isn’t as flexible as we’d like: it only outputs GIF and we’re more into SVG because it can be edited easily after the fact.
There are font-based solutions that let you “type” the timing diagrams. We found Xwave and “Timing Diagram Font“. These work but aren’t particularly flexible; if you want something to happen at odd times, you’re out of luck. Plus, it just feels like a dirty hack, as if that were a bad thing.
Latex users can use tikz-timing, which makes sketching out your timing diagrams as much fun as laying out a very complex table in Latex (that is: not fun at all). On the other hand, it looks good, is ultimately flexible, outputs PDF, and would be scriptable if someone put the time in to write a nice frontend.
So for the next little while, we’re trying out Wavedrom.
What do you use for making timing diagrams?