While today’s unemployment rates are significantly lower than the COVID-19 pandemic peak of 14.7% experienced in April 2020, the fear of job losses remains as workers stare down an uncertain economic future.
Stacker compiled a list of counties with the highest unemployment rates in Tennessee using Bureau of Labor Statistics data. Counties are ranked by their preliminary unemployment rate in January 2024, with initial ties broken by the number of unemployed people within that county, though some ties may remain. County unemployment rates are released about a month behind the national numbers. County-level unemployment rates are not seasonally adjusted.
Experts are mixed in their views of a potential recession. The return of student loan payments, continually high gas prices, persistent inflation, and insurance price escalations are just a few of the factors that could limit consumer spending and potentially prompt another recession. The last economic recession before the pandemic—the Great Recession of 2007-09—sent unemployment rates up to 10% as of October 2009, and a full recovery took years.
📧 Have breaking come to you: Subscribe to News 2 email alerts →
But as of February 2024, the national unemployment rate remains relatively low at 3.9%—up slightly from the previous month. Regional and state employment varies widely depending on local economies. Seasonally adjusted unemployment rates by state demonstrate a rather sizable spectrum, ranging from just 1.9% in North Dakota to 5.3% in Nevada.

Canva
#50. Polk County
– January unemployment rate (preliminary): 3.9%
— 1-month change: Up 0.4 percentage points
— 1-year change: Down 0.4 percentage points
– Total labor force: 7,080 people (277 unemployed)

Canva
#49. Fentress County
– January unemployment rate (preliminary): 3.9%
— 1-month change: Up 0.7 percentage points
— 1-year change: Down 0.4 percentage points
– Total labor force: 7,912 people (308 unemployed)
Canva
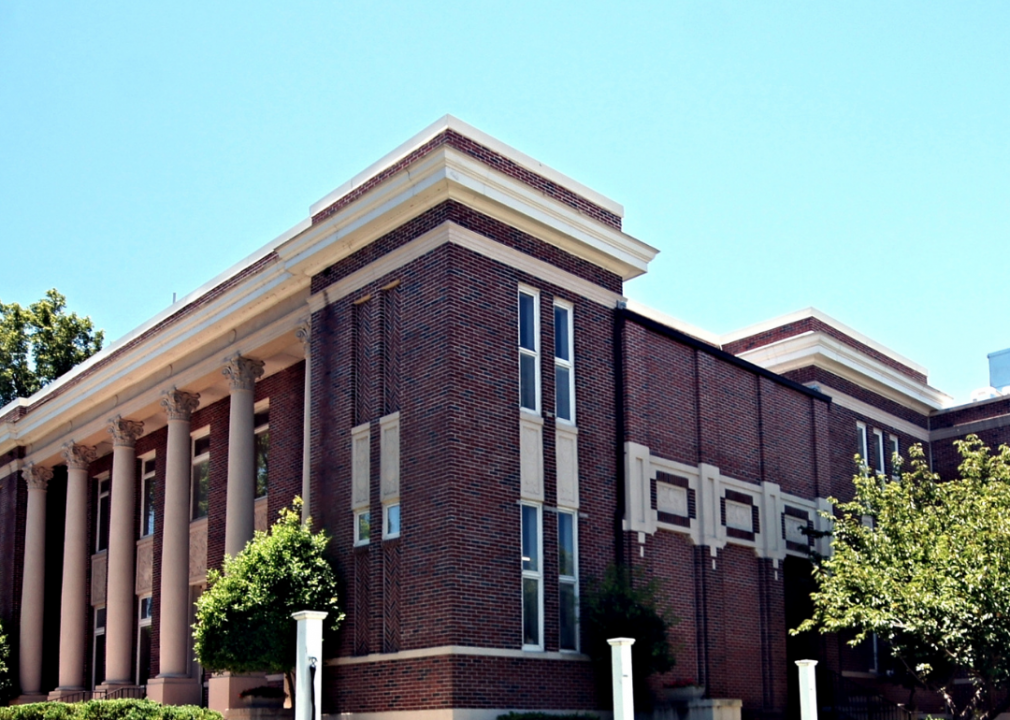
#48. Haywood County
– January unemployment rate (preliminary): 3.9%
— 1-month change: Down 0.1 percentage points
— 1-year change: Down 1.1 percentage points
– Total labor force: 8,403 people (329 unemployed)

Sabrina Janelle Gordon // Shutterstock
#47. Hardin County
– January unemployment rate (preliminary): 3.9%
— 1-month change: Up 0.2 percentage points
— 1-year change: Down 0.2 percentage points
– Total labor force: 10,203 people (395 unemployed)

Canva
#46. Dyer County
– January unemployment rate (preliminary): 3.9%
— 1-month change: Up 0.4 percentage points
— 1-year change: Up 0.1 percentage points
– Total labor force: 16,887 people (667 unemployed)

Canva
#45. Montgomery County
– January unemployment rate (preliminary): 3.9%
— 1-month change: Up 0.4 percentage points
— 1-year change: Up 0.1 percentage points
– Total labor force: 89,313 people (3,479 unemployed)

Canva
#44. Sequatchie County
– January unemployment rate (preliminary): 4.0%
— 1-month change: Up 0.5 percentage points
— 1-year change: Down 0.2 percentage points
– Total labor force: 6,310 people (253 unemployed)

Canva
#43. Union County
– January unemployment rate (preliminary): 4.0%
— 1-month change: Up 0.7 percentage points
— 1-year change: Down 0.2 percentage points
– Total labor force: 7,898 people (317 unemployed)

Canva
#42. Overton County
– January unemployment rate (preliminary): 4.0%
— 1-month change: Up 1.0 percentage points
— 1-year change: Down 0.3 percentage points
– Total labor force: 10,183 people (407 unemployed)

Canva
#41. Obion County
– January unemployment rate (preliminary): 4.0%
— 1-month change: Up 0.6 percentage points
— 1-year change: Down 0.3 percentage points
– Total labor force: 13,095 people (530 unemployed)

Canva
#40. Wayne County
– January unemployment rate (preliminary): 4.1%
— 1-month change: Up 0.6 percentage points
— 1-year change: Down 1.0 percentage points
– Total labor force: 6,615 people (268 unemployed)
Canva
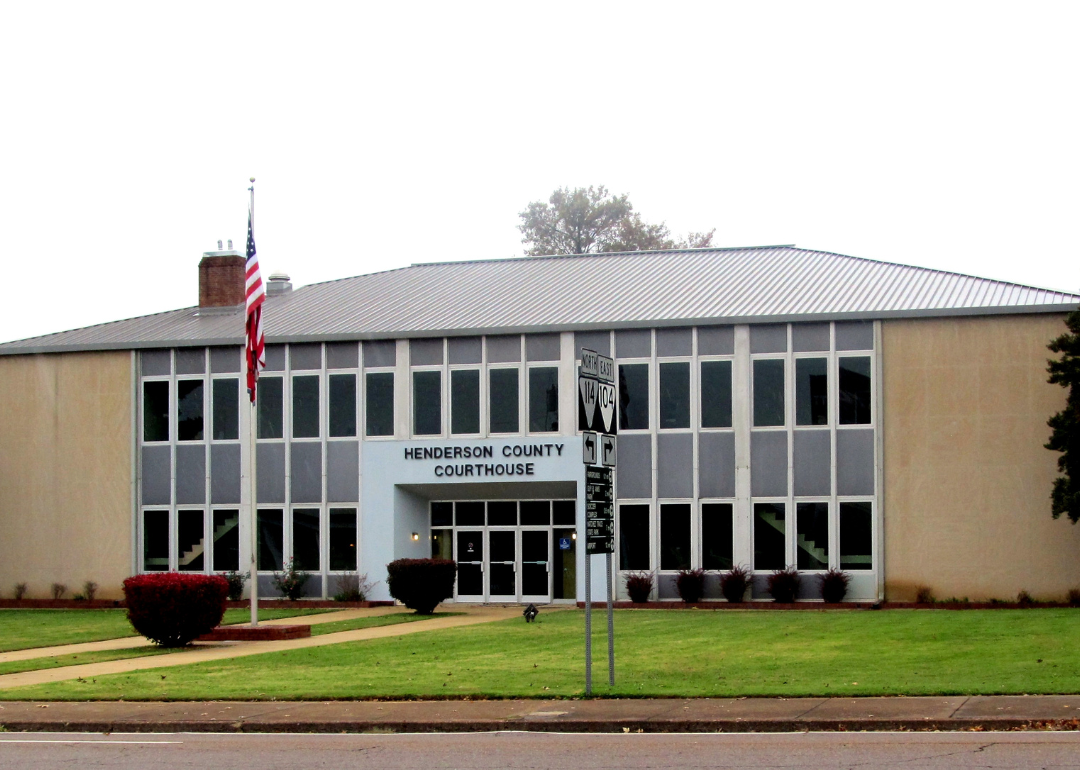
#39. Henderson County
– January unemployment rate (preliminary): 4.1%
— 1-month change: Up 0.7 percentage points
— 1-year change: Up 0.2 percentage points
– Total labor force: 11,761 people (477 unemployed)

Canva
#38. Marion County
– January unemployment rate (preliminary): 4.1%
— 1-month change: Up 0.5 percentage points
— 1-year change: Down 0.1 percentage points
– Total labor force: 12,607 people (521 unemployed)

Canva
#37. Henry County
– January unemployment rate (preliminary): 4.1%
— 1-month change: Up 0.6 percentage points
— 1-year change: Down 0.4 percentage points
– Total labor force: 13,686 people (557 unemployed)

Canva
#36. Roane County
– January unemployment rate (preliminary): 4.1%
— 1-month change: Up 0.7 percentage points
— 1-year change: Up 0.3 percentage points
– Total labor force: 23,977 people (975 unemployed)

Canva
#35. Benton County
– January unemployment rate (preliminary): 4.2%
— 1-month change: Up 0.5 percentage points
— 1-year change: Down 0.5 percentage points
– Total labor force: 6,851 people (287 unemployed)

Canva
#34. Hawkins County
– January unemployment rate (preliminary): 4.2%
— 1-month change: Up 0.6 percentage points
— 1-year change: Up 0.2 percentage points
– Total labor force: 23,256 people (977 unemployed)

SevenMaps // Shutterstock
#33. Tipton County
– January unemployment rate (preliminary): 4.2%
— 1-month change: Up 0.6 percentage points
— 1-year change: Up 0.6 percentage points
– Total labor force: 27,166 people (1,134 unemployed)
Canva
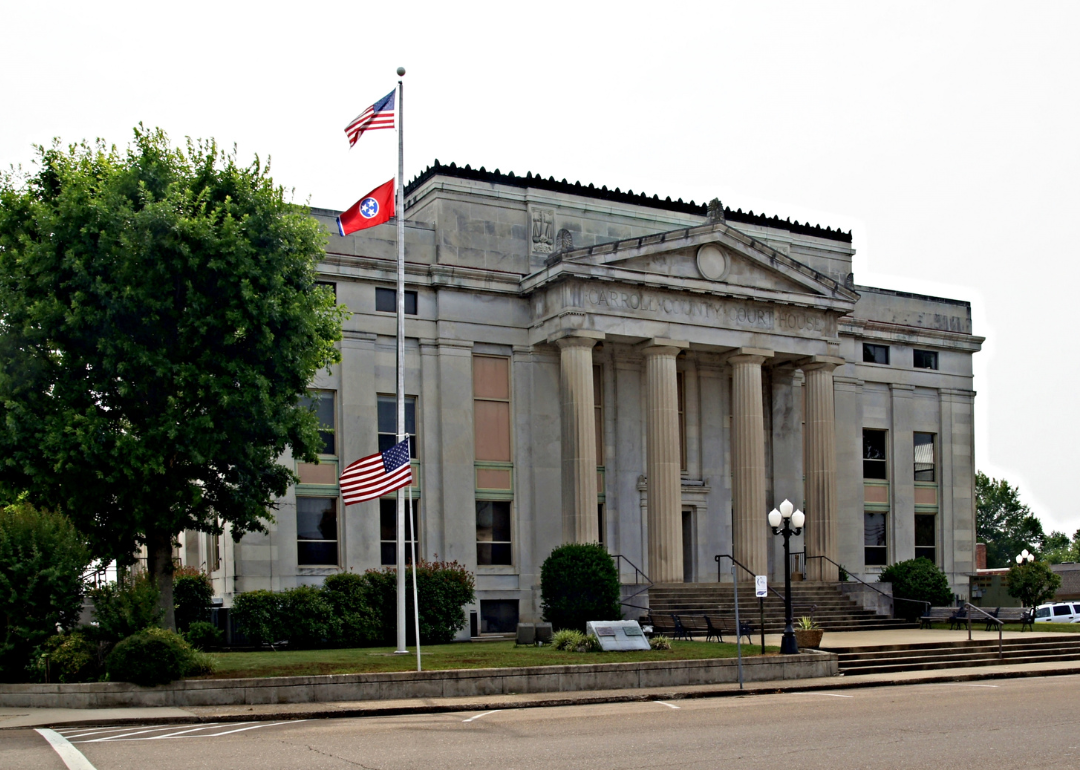
#32. Carroll County
– January unemployment rate (preliminary): 4.3%
— 1-month change: Up 0.6 percentage points
— 1-year change: Down 0.3 percentage points
– Total labor force: 11,758 people (507 unemployed)

Canva
#31. Claiborne County
– January unemployment rate (preliminary): 4.3%
— 1-month change: Up 0.8 percentage points
— 1-year change: Down 0.1 percentage points
– Total labor force: 12,780 people (547 unemployed)
Canva
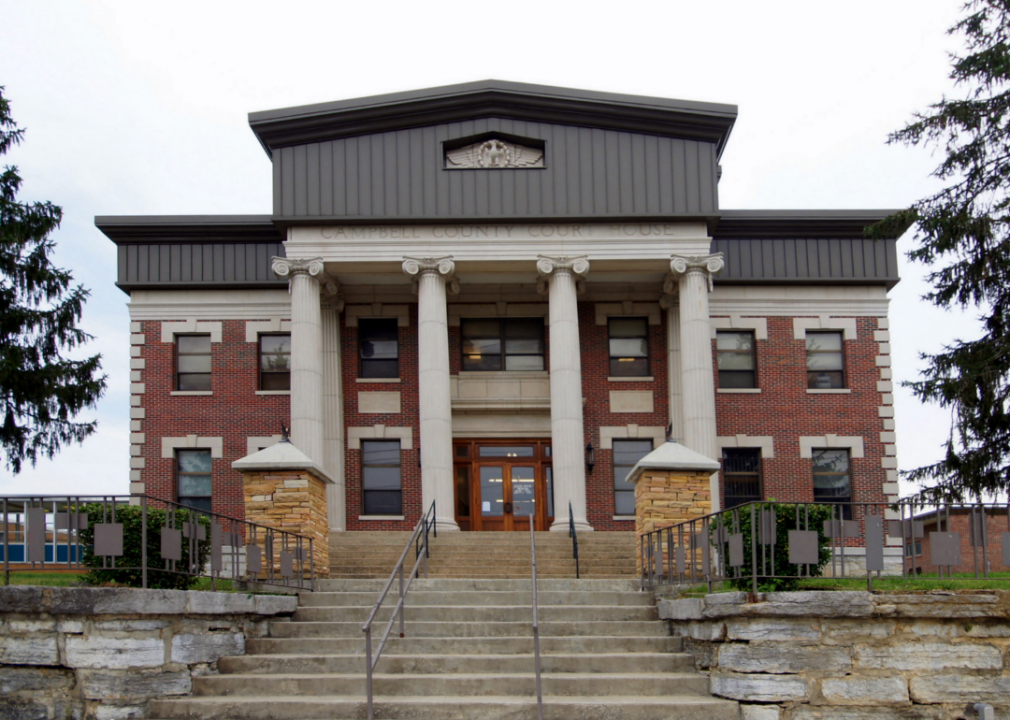
#30. Campbell County
– January unemployment rate (preliminary): 4.3%
— 1-month change: Up 0.7 percentage points
— 1-year change: Down 0.2 percentage points
– Total labor force: 15,053 people (652 unemployed)

Canva
#29. Jackson County
– January unemployment rate (preliminary): 4.4%
— 1-month change: Up 0.8 percentage points
— 1-year change: No change
– Total labor force: 4,772 people (211 unemployed)

Canva
#28. Grundy County
– January unemployment rate (preliminary): 4.4%
— 1-month change: Up 0.7 percentage points
— 1-year change: No change
– Total labor force: 5,202 people (228 unemployed)
Canva
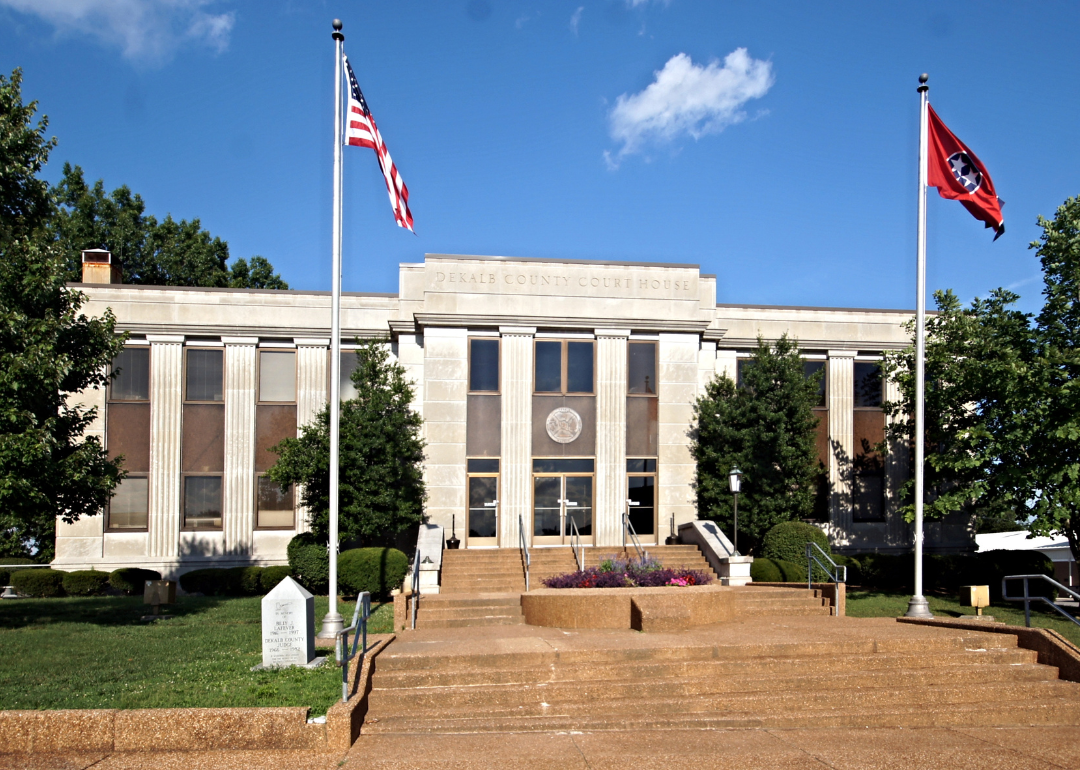
#27. DeKalb County
– January unemployment rate (preliminary): 4.4%
— 1-month change: Up 0.7 percentage points
— 1-year change: Up 0.4 percentage points
– Total labor force: 7,738 people (344 unemployed)

Canva
#26. McMinn County
– January unemployment rate (preliminary): 4.4%
— 1-month change: Up 0.7 percentage points
— 1-year change: Down 0.1 percentage points
– Total labor force: 21,142 people (931 unemployed)

Canva
#25. Jefferson County
– January unemployment rate (preliminary): 4.4%
— 1-month change: Up 1.3 percentage points
— 1-year change: Down 0.3 percentage points
– Total labor force: 24,917 people (1,094 unemployed)
Canva
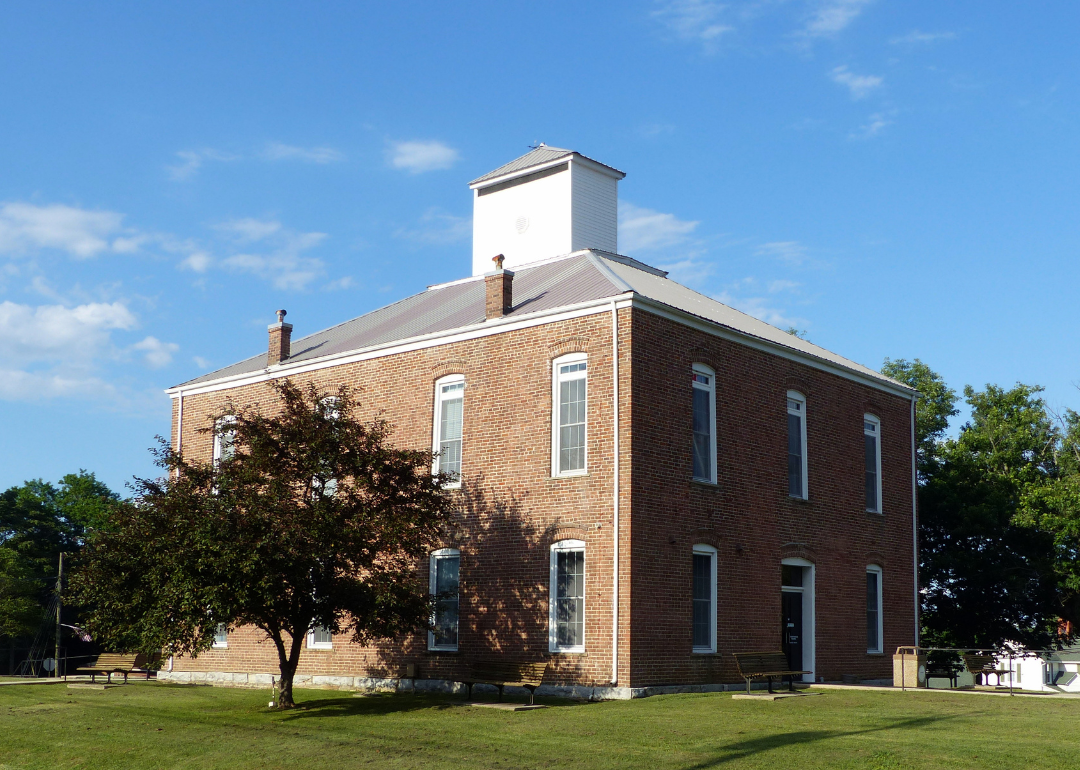
#24. Van Buren County
– January unemployment rate (preliminary): 4.5%
— 1-month change: Up 0.4 percentage points
— 1-year change: Up 0.6 percentage points
– Total labor force: 2,125 people (95 unemployed)

Canva
#23. Morgan County
– January unemployment rate (preliminary): 4.5%
— 1-month change: Up 1.0 percentage points
— 1-year change: Down 0.2 percentage points
– Total labor force: 7,967 people (359 unemployed)
Canva
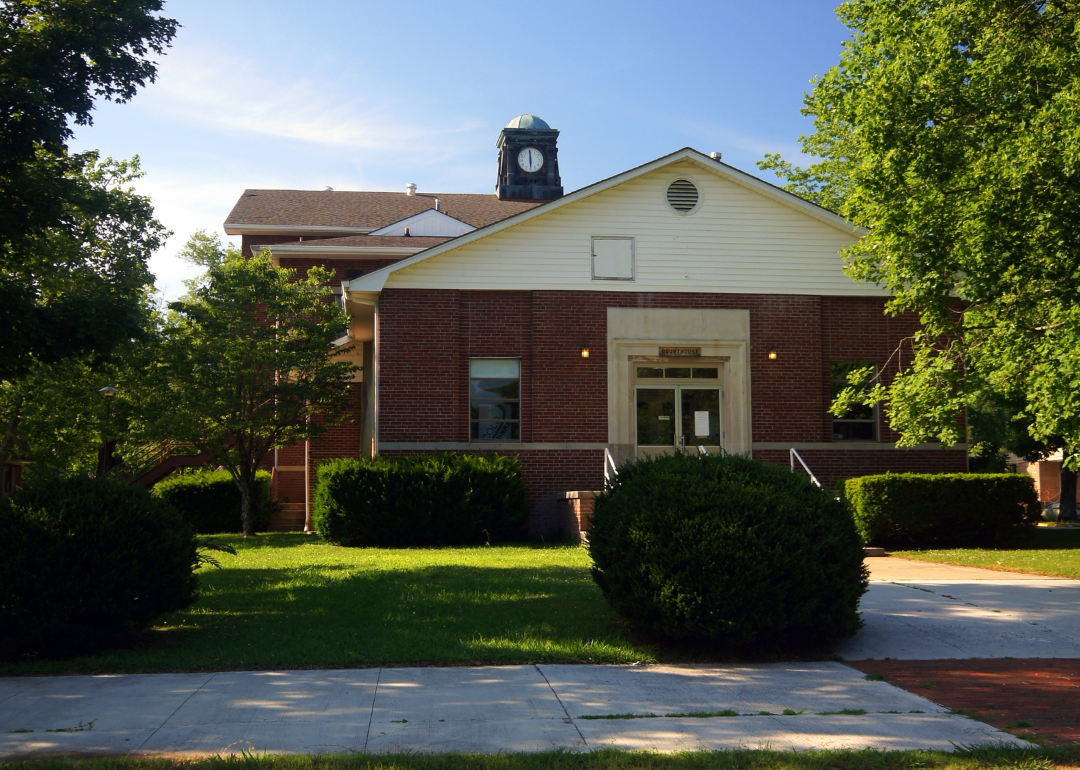
#22. Scott County
– January unemployment rate (preliminary): 4.5%
— 1-month change: Up 0.6 percentage points
— 1-year change: Down 0.8 percentage points
– Total labor force: 8,142 people (365 unemployed)

Canva
#21. Lake County
– January unemployment rate (preliminary): 4.6%
— 1-month change: Up 0.7 percentage points
— 1-year change: Down 0.4 percentage points
– Total labor force: 1,624 people (74 unemployed)
Dee Browning // Shutterstock
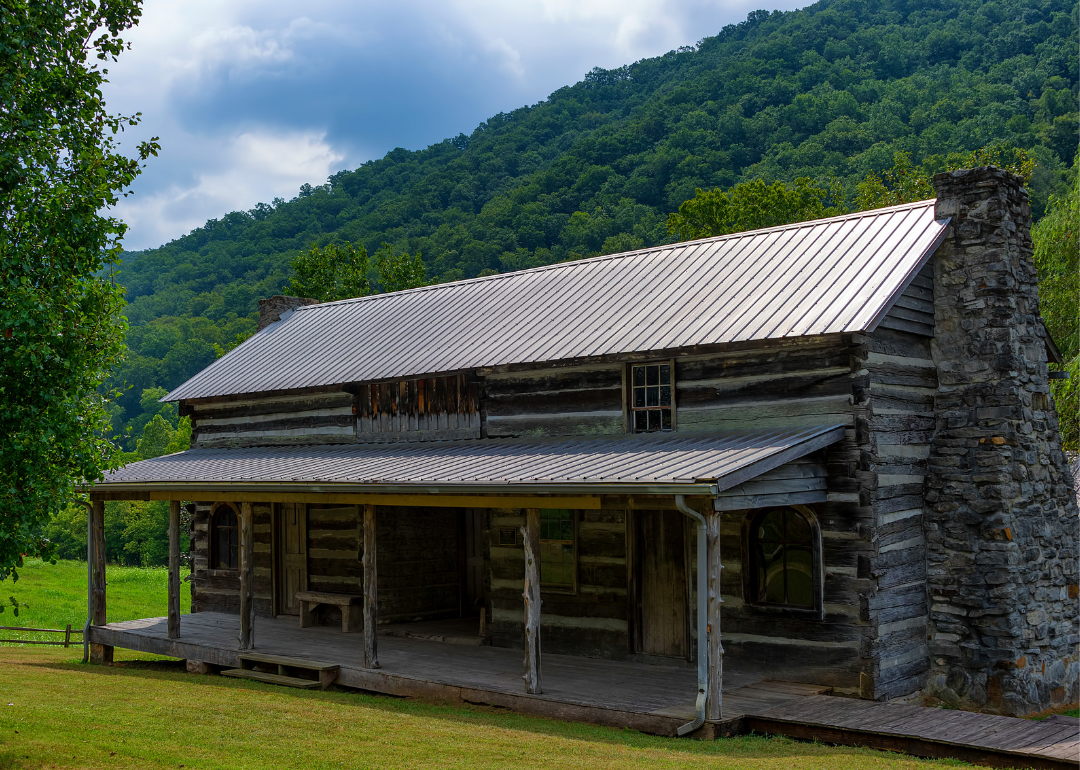
#20. Hancock County
– January unemployment rate (preliminary): 4.6%
— 1-month change: Up 0.8 percentage points
— 1-year change: Up 0.1 percentage points
– Total labor force: 2,328 people (106 unemployed)

Canva
#19. McNairy County
– January unemployment rate (preliminary): 4.6%
— 1-month change: Up 0.5 percentage points
— 1-year change: Down 0.2 percentage points
– Total labor force: 8,379 people (389 unemployed)
Canva
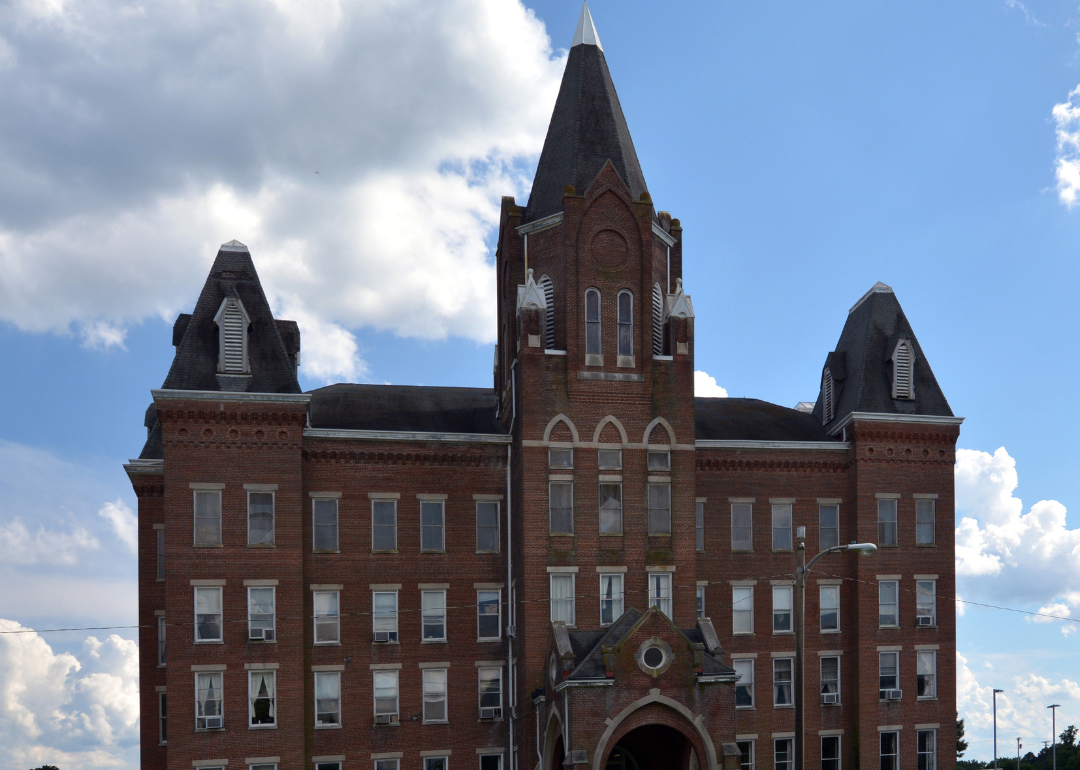
#18. Hardeman County
– January unemployment rate (preliminary): 4.6%
— 1-month change: No change
— 1-year change: No change
– Total labor force: 8,911 people (414 unemployed)

Canva
#17. Rhea County
– January unemployment rate (preliminary): 4.6%
— 1-month change: Up 0.7 percentage points
— 1-year change: Down 0.5 percentage points
– Total labor force: 13,530 people (623 unemployed)

Canva
#16. Loudon County
– January unemployment rate (preliminary): 4.6%
— 1-month change: Up 1.6 percentage points
— 1-year change: Up 1.4 percentage points
– Total labor force: 24,968 people (1,151 unemployed)

Canva
#15. Sevier County
– January unemployment rate (preliminary): 4.6%
— 1-month change: Up 2.2 percentage points
— 1-year change: Down 1.2 percentage points
– Total labor force: 55,955 people (2,563 unemployed)

Canva
#14. Shelby County
– January unemployment rate (preliminary): 4.6%
— 1-month change: Up 0.6 percentage points
— 1-year change: Up 0.1 percentage points
– Total labor force: 427,308 people (19,804 unemployed)

Canva
#13. Greene County
– January unemployment rate (preliminary): 4.7%
— 1-month change: Up 0.8 percentage points
— 1-year change: Down 0.3 percentage points
– Total labor force: 28,788 people (1,351 unemployed)

Canva
#12. Monroe County
– January unemployment rate (preliminary): 4.8%
— 1-month change: Up 1.6 percentage points
— 1-year change: Up 1.2 percentage points
– Total labor force: 20,859 people (999 unemployed)
Canva
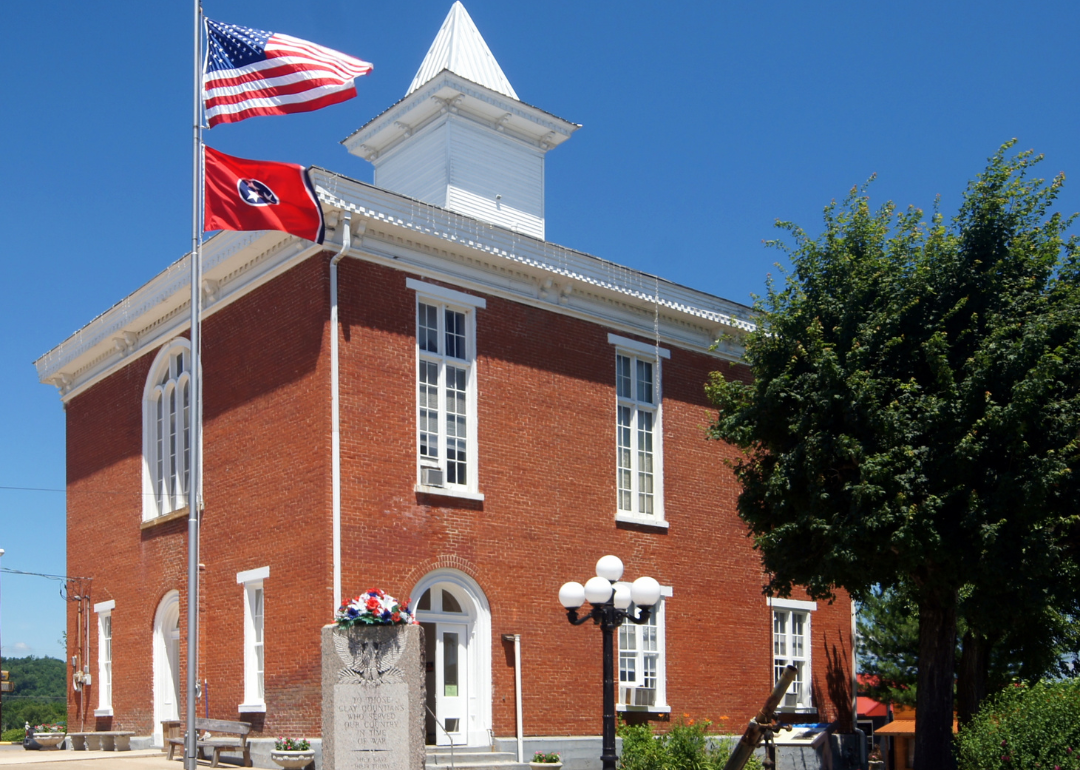
#11. Clay County
– January unemployment rate (preliminary): 4.9%
— 1-month change: Up 0.8 percentage points
— 1-year change: Up 0.2 percentage points
– Total labor force: 2,850 people (139 unemployed)

Canva
#10. Unicoi County
– January unemployment rate (preliminary): 4.9%
— 1-month change: Up 0.8 percentage points
— 1-year change: Up 0.2 percentage points
– Total labor force: 7,125 people (348 unemployed)

Canva
#9. Pickett County
– January unemployment rate (preliminary): 5.0%
— 1-month change: Up 0.8 percentage points
— 1-year change: Up 0.6 percentage points
– Total labor force: 2,056 people (103 unemployed)
SevenMaps // Shutterstock
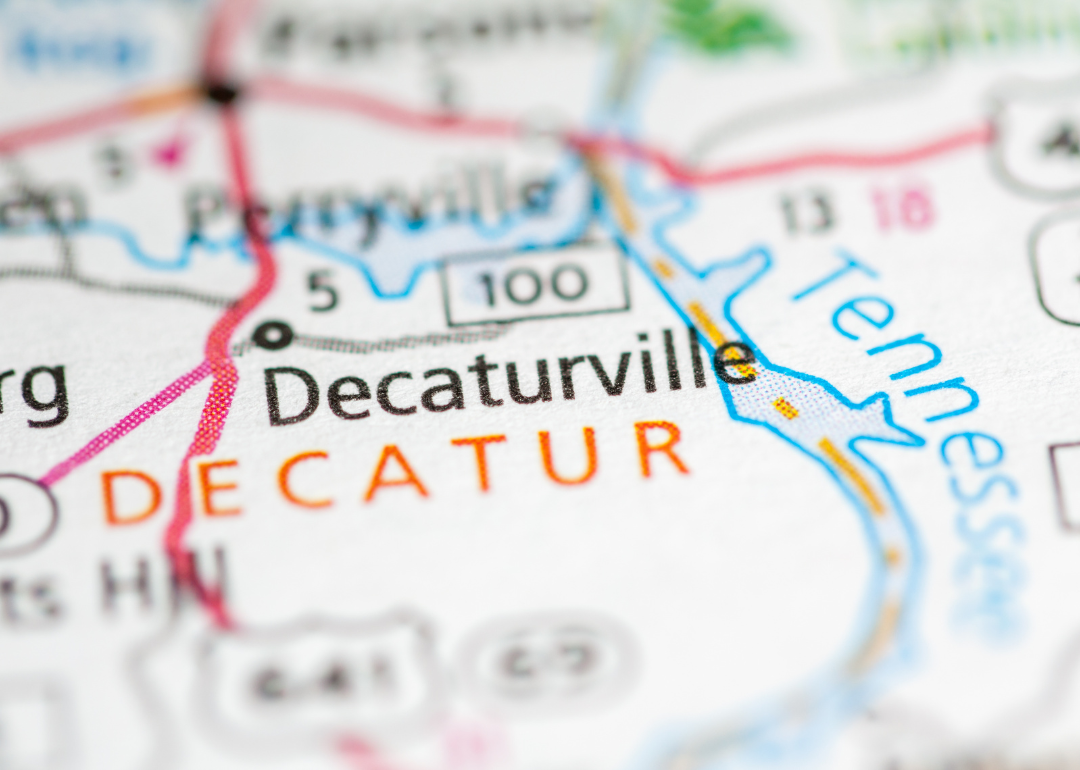
#8. Decatur County
– January unemployment rate (preliminary): 5.0%
— 1-month change: Up 1.0 percentage points
— 1-year change: Down 1.0 percentage points
– Total labor force: 4,408 people (220 unemployed)

Canva
#7. Cumberland County
– January unemployment rate (preliminary): 5.2%
— 1-month change: Up 1.0 percentage points
— 1-year change: No change
– Total labor force: 24,078 people (1,248 unemployed)

Sabrina Janelle Gordon // Shutterstock
#6. Houston County
– January unemployment rate (preliminary): 5.4%
— 1-month change: Up 1.2 percentage points
— 1-year change: Up 0.1 percentage points
– Total labor force: 3,281 people (177 unemployed)

Maxine Livingston // Shutterstock
#5. Bledsoe County
– January unemployment rate (preliminary): 5.4%
— 1-month change: Up 0.6 percentage points
— 1-year change: Down 0.5 percentage points
– Total labor force: 4,594 people (247 unemployed)
Canva
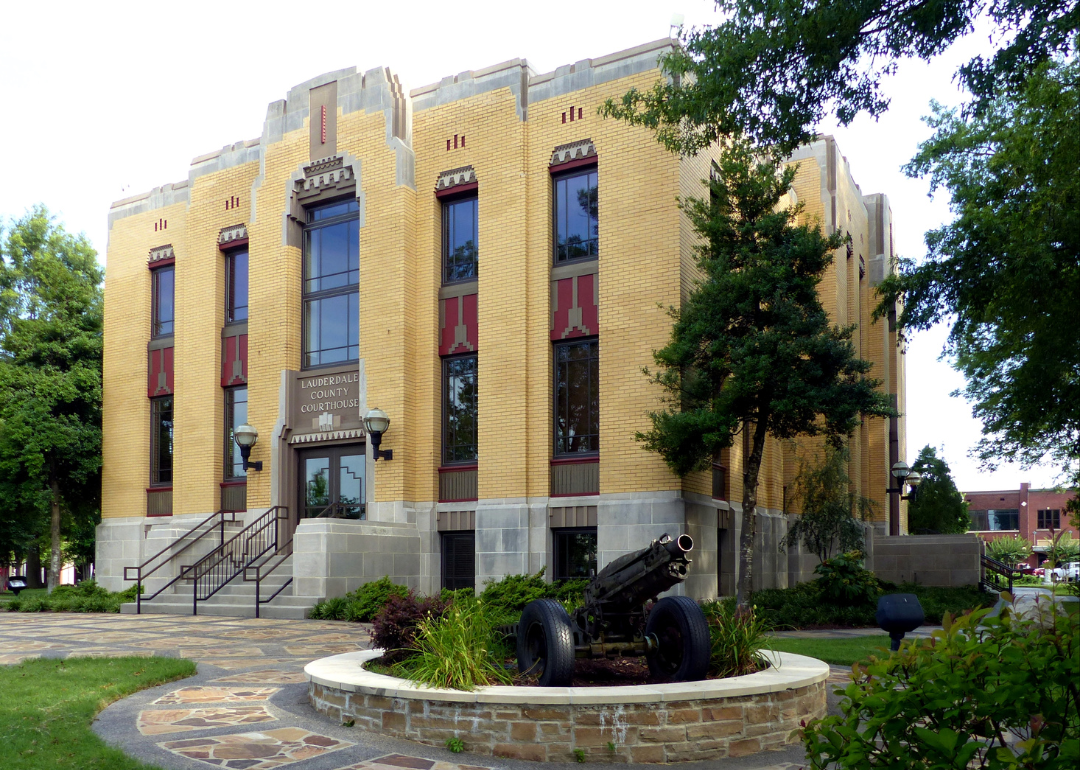
#4. Lauderdale County
– January unemployment rate (preliminary): 5.6%
— 1-month change: Up 0.9 percentage points
— 1-year change: Up 0.4 percentage points
– Total labor force: 9,332 people (522 unemployed)

Canva
#3. Perry County
– January unemployment rate (preliminary): 5.7%
— 1-month change: Up 1.5 percentage points
— 1-year change: Down 4.1 percentage points
– Total labor force: 2,780 people (158 unemployed)
Canva
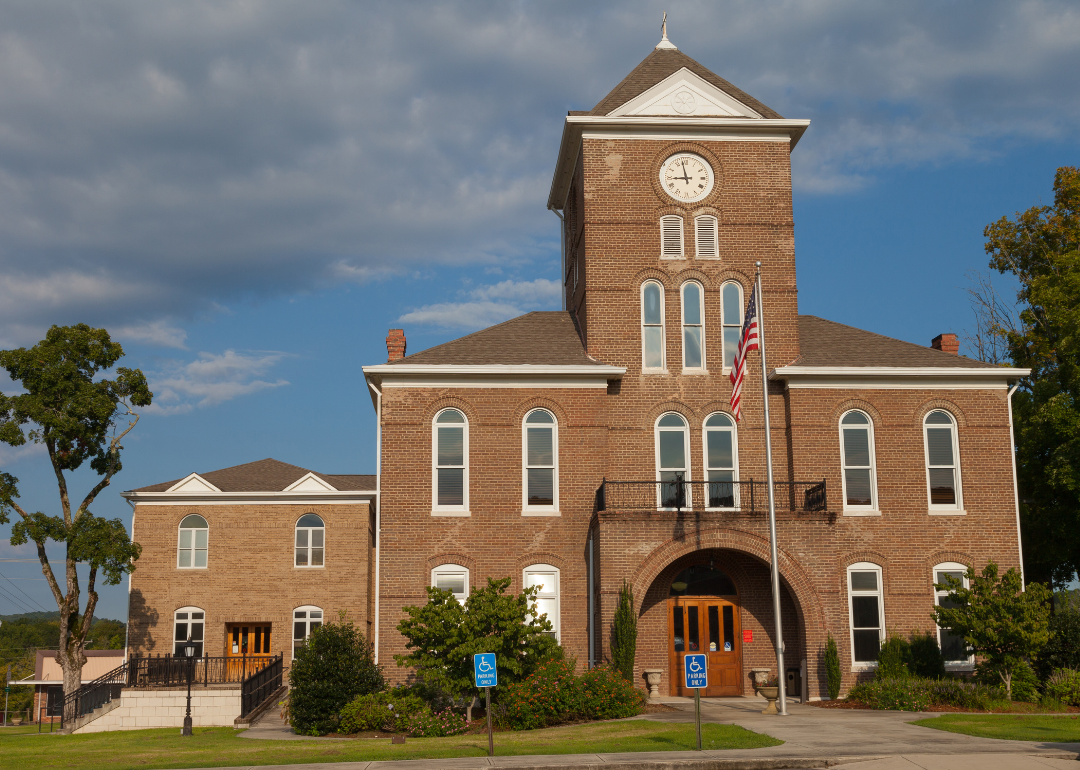
#2. Meigs County
– January unemployment rate (preliminary): 5.7%
— 1-month change: Up 1.1 percentage points
— 1-year change: Up 0.6 percentage points
– Total labor force: 4,822 people (277 unemployed)

Canva
#1. Cocke County
– January unemployment rate (preliminary): 5.7%
— 1-month change: Up 2.1 percentage points
— 1-year change: Down 1.3 percentage points
– Total labor force: 14,855 people (844 unemployed)
This story features data reporting by Paxtyn Merten and is part of a series utilizing data automation across 50 states.


