About the Cloud Lab
Clouds are more than just clues to everyday weather; they can also help us understand high-impact events like major storms and future climate change. Scientists create mathematical representations, or models, of the climate system to help predict future changes. These models are based on an understanding of oceans and land surfaces and other atmospheric factors including clouds. But of all the components that make up the climate model, clouds are one of the least understood. With an increased understanding of clouds, scientists will be able to improve the climate models and better predict climate change.
In the Cloud Lab, you’ll learn how to classify clouds and what those cloud types mean for our weather. You’ll also analyze data like cloud temperature and height, storm height, and rainfall rate and discover how that data can predict the intensity and movement of a storm. You’ll also use NASA’s powerful Worldview tool to browse global satellite imagery from the past and present. We’ve customized the tool to give you quick access to the data layers that pertain specifically to storm formation like cloud top pressure and water vapor, among others. This real-time data is pulled from the MODIS (Moderate Resolution Imaging Spectroradiometer) instrument on the Terra and Aqua satellites.
The Cloud Lab includes four activities and a series of videos:
Cloud Typing
We see clouds all the time, but are we really paying attention to their variations and what they can tell us about the atmosphere above and the weather ahead? This gallery of images challenges you to look closely and determine each cloud type. Use the key to identify and learn about each type while earning points and collecting your favorite images along the way.
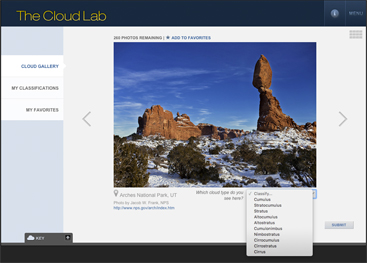
The Cloud Gallery contains hundreds of images for you to classify as you learn how to identify cloud types.
From NOVA's Cloud Lab
Inside a Megastorm
Hurricane Sandy was one of the most devastating and costly storms ever to strike the U.S. Follow the storm’s development as it begins as a tropical depression, intensifies into a category three hurricane, and finally winds down and the clean up begins. NASA satellite imagery and video clips from NOVA’s “Inside the Megastorm” help visualize Sandy’s progression from the southwestern Caribbean Sea to landfall on the U.S. eastern coast.
Analysis and Reconstruction
Scientists analyze data like cloud temperature and height, storm height, and rainfall rate to predict a storm’s growth and movement. In this game, you’ll analyze data that was collected during the development of three tropical cyclones and then use that data to reconstruct the storms’ paths.
Storm Prediction
Customized for the Cloud Lab, the NASA Worldview tool let’s you access the same satellite data and imagery that scientists use. View storms developing in real-time or go back in time to trace the movement of historical storms. Use overlay data like water vapor, cloud top temperature and pressure, land surface temperature, and precipitation estimate to investigate how storms develop and change over time.

Access satellite data and images from NASA's Worldview tool.
From NOVA's Cloud Lab
Videos
The Cloud Lab includes six short videos about the making of a cloud and cloud types, the role of clouds in weather and storms, and why scientists are studying the connection between clouds and climate. These videos can be viewed in the Cloud Lab Video Quizzes or in our NOVA Labs Video Library.
To learn more about clouds, weather, and storms begin the Cloud Lab challenge now.