
Abstract
In this paper we present a facile method for the synthesis of aminated graphene derivative through simultaneous reduction and amination of graphene oxide via two-step liquid phase treatment with hydrobromic acid and ammonia solution in mild conditions. The amination degree of the obtained aminated reduced graphene oxide is of about 4 at.%, whereas C/O ratio is up to 8.8 as determined by means of X-ray photoelectron spectroscopy. The chemical reactivity of the introduced amine groups is further verified by successful test covalent bonding of the obtained aminated graphene with 3-Chlorobenzoyl chloride. The morphological features and electronic properties, namely conductivity, valence band structure and work function are studied as well, illustrating the influence of amine groups on graphene structure and physical properties. Particularly, the increase of the electrical conductivity, reduction of the work function value and tendency to form wrinkled and corrugated graphene layers are observed in the aminated graphene derivative compared to the pristine reduced graphene oxide. As obtained aminated graphene could be used for photovoltaic, biosensing and catalysis application as well as a starting material for further chemical modifications.
Introduction
In the past years derivatization of graphene has become one of the central topics in the field of nanocarbon materials studies1,2. Significant efforts are being made to obtain graphene derivatives covalently modified by various functional groups, containing oxygen, nitrogen, sulfur, halogens and other elements3,4. As a result, the family of functionalized graphenes has grown dramatically during recent years5. Such excitement for the graphene functionalization is a result of wide opportunities in tailoring its physical and chemical properties which are being opened by adding certain type and number of organic moieties onto either graphene basal plane or its edges. Graphene derivatization allows to tune material electrical resistivity, luminescence properties, and optical transmittance, open and vary band gap what is of high interest for electronic, optoelectronic and electrochemical applications6,7,8. The addition of chemically reactive moieties, such as carboxyls, amides or amines9,10 modifies graphene reactivity, surface energy and surface chemistry, substantially improving the performance of graphene-based catalysts, gas sensors, and biosensors11,12,13. And last but not least, functionalization supports the successful dispersion of graphene in organic solvents, which the main issue in processing the graphene-based materials14.
Besides the most known graphene derivatives, graphene oxide (GO) and reduced graphene oxide (rGO)15,16,17,18, as well as fluorographene and graphane19,20, amino-functionalized graphene is another derivative also being extensively studied nowadays. Primary amines represent attractive functionalities that enable an easy graphene grafting through amide coupling or so-called “click” reactions. Such an approach makes possible to covalently functionalize graphene with a large variety of biomolecules, particularly DNA strands and aptamers, as well as with carboxylated forms of carbon nanotubes or fullerenes21. Moreover, as amine is proved to be an electron-withdrawing group the functionalization of graphene with amines modify its electronic structure, in particular, enhance conductivity and provide controllable work function engineering22. As a net result, aminated graphene is regarded as a promising material for various applications in photovoltaic, gas sensing and biosensing, drug delivery and composite formation12,23,24,25.
Various strategies for amine functionalization of graphene are currently used. For instance, Baraket et al.11 have demonstrated successful graphene grafting with about 9 at.% of primary amines using electron beam produced Ar/NH3 plasma. Zhang et al.24 have also reported the formation of amino-functionalized graphene via Hoffman rearrangement using graphene oxide as a starting material with amine content of around 4 at.%. However, the applied procedure involves several stages, requires hazardous reagents and works only on the edges of graphene flakes. The hydrothermal approach is widely used for graphene functionalization and, particularly, for nitrogen doping of graphene oxide via reaction with ammonia, melamine, etc26,27,28. However, all these reactions entail the use of autoclave operating at rather high temperatures (up to 195 °C) and, therefore, mostly provide incorporation of such nitrogen-containing heterocycles as pyrroles and pyridines, than the formation of amines. Recently, one-pot graphene oxide amination and reduction via Leuckart reaction, which involves the conversion of a carbonyl group of an aldehyde or a ketone into the amine group, was reported by Aguilar-Bolados et al.29. Although the proposed method is simple and easy operational its efficiency is noticeably limited by localization of the formed amines on the edges of GO platelets. Additionally, the as-synthesized GO commonly contains a rather small amount of carbonyls (around 2–3 at.%) and the increase of their content requires additional GO processing, for instance, via liquid-phase partial reduction30.
Apparently, the direct substitution of GO basal plane groups (hydroxyl and epoxide ones) by amine groups with the simultaneous restoration of the sp2-conjugated graphene network is the most attractive and effective way to obtain amino-functionalized graphene. This cannot be done straightforwardly in mild conditions; however, one solution is to use an additional step of GO reductive bromination. Earlier it was demonstrated that GO treatment with bromine solutions or hydrobromic acid results in graphene oxide reduction and functionalization by bromine with as high as ~5 at.% bromine concentration5,31,32 Considering the high reactivity of bromine moieties, especially for substitution reactions, one can further easily obtain aminated graphene by treating prepared brominated graphene with ammonia.
This paper reports for the first time a scalable and facile approach for the formation of aminated graphene (rGO-Am) through two-step GO treatment with hydrobromic acid and ammonia solution in mild conditions. The effect of bromine and amine functionalization on morphology and electronic characteristics of graphene is discussed as well, providing further insights into the tuning of graphene physical and chemical properties via its derivatization.
Results and Discussion
Chemical composition analysis
X-ray photoelectron spectroscopy (XPS) was used to determine the chemical composition of the initial graphene oxide (GO), brominated graphene (rGO-Br) and aminated graphene (rGO-Am). Figure 1a presents the survey XPS spectra. The survey spectra of the initial GO contain only C1s and O1s peaks, at ~284.7 eV and ~532.6 eV, respectively, indicating the absence of any impurities. The features related to Si near 100 eV (Si2p) and 151 eV (Si2) are due to the signal from Si substrate, underlying the studied sample. After the bromination procedure, Br3d peak at ~69 eV and Br3p doublet around ~182 and 189 eV appear, thereby confirming the presence of bromine moieties in rGO-Br sample. Considering the relevant atomic sensitivity factors, the atomic concentration of bromine calculated from the survey spectrum and was determined to be ~5.3 at.%. To analyze whether the revealed bromine is covalently bonded to graphene or just physisorbed to it the high-resolution Br3d spectrum was further measured and deconvoluted (Fig. 1b). The set of six peaks combined into three doublets are resolved in the obtained spectrum: doublet at 67.8 (Br3d5/2) and 68.8 eV (Br3d3/2) is related to free Br− 31,32, two analogous doublets at 70.0 and 71.0 eV, and at 72.7 and 73.8 eV, respectively, correspond to bromine atoms covalently bonded to carbon31,32,33 and to oxygen34. The relative areas of these doublets are easily determined and are, ~23.8% for free Br−, 74.9% for C-Br, and 1.3% for O-Br. Accordingly, the concentration of C-Br species appears to be about ~3.96 at.%, what is comparable and even higher than the values obtained by other researchers31,32,33.

(a) X-ray photoelectron survey spectra of the initial GO, rGO-Br and rGO-Am. (b) High-resolution Br3d XPS spectrum of rGO-Br. (c) High-resolution N1s XPS of rGO-Am. (d) High-resolution C1s spectra of the initial GO and modified rGOs. For clarity, C1s spectrum and their fits are vertically offset from the fitting components. The C1s spectra were fitted by Shirley background and a set of one asymmetric Doniach-Sunjic function (DS) and five symmetric Gaussian−Lorentzian product functions (Gaussian by 70% and Lorentzian by 30%) (GL(30)), while the O1s spectra were fitted by only the GL(30) functions whose number varied from 3 to 5.
The subsequent rGO-Br treatment with the ammonia solution resulted in the complete elimination of Br3d and Br3p lines from the XPS survey spectrum and the expected appearance of N1s signal at ~400 eV. This confirms the successful substitution of bromine species by nitrogen functionalities which concentration in rGO-Am was determined to be around 5.5 at.%. The higher nitrogen content in comparison to bromine is probably due to additional incorporation of nitrogen occurring via reductive amination of the retained oxygen-containing groups in ammonia enviroment35,36. The curve fitting of the obtained high-resolution N1s spectrum (Fig. 1c) demonstrates the presence of four bands positioned at 398.4, 399.8, 401.4 and 403.8 eV and respectively corresponding to pyridines, amines, graphitic nitrogen and pyridine-N-oxide36,37. As seen from the spectrum, amine functionality with its peak area percentage of 72% appears to be a dominant type of nitrogen species, while the other ones, pyridine, graphitic nitrogen or pyridine-N-oxide, demonstrate much less relative content, not exceeding 10%. The data of NK edge XAS technique also confirms, although only qualitatively, the presence of significant amounts of amines and pyridines in the as-obtained material (Supplementary Fig. S1). The successful amination is additionally indicated by the means of Fourier-transform infrared spectroscopy (FTIR) (Supplementary Fig. S2). After the GO treatment, the characteristic absorption bands at 2970–3700 cm−1, 1365 cm−1, 1220 cm−1 and 980 cm−1 related to the interlayer water and oxygen functionalities diminish38. At the same time, new doublet at 3422 cm−1 and 3306 cm−1 along with peaks at 1560 cm−1, 1260 cm−1 and 795 cm−1 corresponding to N-H stretching of primary amines, N-H bending of primary amines, C-N stretching and N-H wag, respectively39,40, appear and become dominant. The additional bands at 1404 cm−1 2920 cm−1 attributed to C-H/C-H2 vibrations are due to the isopropyl alcohol molecules retained after the sample preparation.
Graphene oxide bromination and subsequent amination are accompanied by the elimination of oxygen-containing groups what is implied by significant diminishing of O1s peak in the rGO-Am survey spectra. This fact is further emphasized by the detailed peak-fitting analysis of the high-resolution C1s core level spectra (Fig. 1d) in which seven distinct peaks are resolved. Three peaks centered at 283.9 eV, 284.7 eV, and 285.1 eV are respectively related to the vacancy defects of graphene lattice (peak C−V)41, sp2-bonded carbons of aromatic domains (C=C) and carbon atoms with the bonds distorted due to attachment of functional groups at a neighboring atom (C-C)9,41,42,43. The C=C peak exhibits asymmetric shape due to excitonic screening in sp2-conjugated graphene network of aromatic domains observed not only in graphite or graphene C1s XPS spectra but as well in the same spectra of highly reduced graphene oxide obtained by its high-temperature annealing (rGO-HT) (Supplementary Fig. S3)43,44. The other three peaks located at 286.7, 288.2 and 289.1 eV correspond to hydroxyl and epoxide (C-OH&C-O-C), carbonyl (C=O), and carboxyl (COOH) groups, respectively42,45. The last resolved peak at ~290.2 eV corresponds to π − π* shakeup satellite of the peak C=C. Quantitative analysis of the deconvoluted C1s XPS spectra (Table 1) demonstrates that initial GO has a rather high degree of oxidation with C/O ratio of 1.95. After the GO bromination, the concentration of its basal plane groups significantly reduces and the overall C/O ratio rises up to 4.18. As shown by Zheng, J. et al.33, the peak at 286.2 eV clearly observed in the XPS of brominated graphene may be assigned to the C–Br bonds. Thus, the similar broad feature observed in the C1s XPS spectrum of rGO-Br at 286.6 eV might be attributed to the sum of C–Br and C-OH&C-O-C peaks, suggesting even lower oxygen-groups content. Assuming this fact and taking into account the aforementioned bromine concentration of 3.4 at.% we obtain that the recalculated C/O ratio becomes equal to 5.02.
After the amination step, this ratio demonstrates further growth reaching for the rGO-Am the value of 8.85, due to the additional elimination of oxygen-containing groups and by their substitution with amines. The noted value of the C/O ratio is close to that obtained for rGOs prepared by chemical reduction using common reducing agents, namely, hydrazine, benzylamine, various alcohols and sodium borohydride18,46. The high reduction degree of rGO-Am is also emphasized by the results of UV-Vis spectroscopy (Supplementary Fig. S4), demonstrating restoration of graphene conjugated structure. The accurate deconvolution of the rGO-Am C 1 s spectrum also revealed the appearance of the C-N peak centered at 285.8 eV29,47, which overlaps with the peak near 286.2 eV, corresponding to the phenol groups (C-OH(p)). These oxygen species are known to be highly stable to elimination via various reduction techniques9,30 retaining even after GO thermal reduction with the presence of the peaks located at 286.1–286.3 eV and 533.4–533.6 eV in the C 1 s and O 1 s XPS spectra, respectively.
Study of the morphological features
The structural features of the obtained brominated and aminated graphenes were further studied by the means of different techniques such as atomic force microscopy (AFM), X-ray diffraction (XRD), transmission electron microscopy (TEM), scanning electron microscopy (SEM) and Raman spectroscopy. Representative bright field low magnification TEM images (Fig. 2) demonstrate the morphology of the initial GO, rGO-Br, and rGO-Am. No rips or nanoscale holes are observed in the initial GO, indicating its defect-free structure on the nanoscale level (Fig. 2a). The corresponding hexagonal ED patterns formed by the set of sharp spots confirmed the monolayer nature of the studied GO since characteristic intensity ratio of different spot groups, what is further verified by AFM images and XRD patterns (Supplementary Fig. S5). After the bromination procedure rGO-Br continues to exhibit lamellar defect-free structure and monolayer platelets can be distinguished in the sample (Fig. 2b). Well-preserved crystalline structure with the long-range order up to tens of nanometers retains after amination as well. However, rGO-Am demonstrates a tendency to scroll and wrinkle of initially flat graphene monolayer platelets leading to the formation of local multilayer areas distributed within single rGO-Am platelet. This is evident from the TEM image (Fig. 2c) and the corresponding ED pattern. ED pattern consists of distinguishable hexagonal diffraction patterns rotated with respect to each other (Fig. 2c). Diffraction spot intensities corresponding to the adjacent sheet areas in these diffraction patterns significantly differ from each other because of the different surface areas falling into the selective aperture of the microscope. At the same time, the intensities would be almost identical in the case of a bi- or trilayer sheets because one sheet lying under another has the same area within the aperture.

TEM images and corresponding selective area electron diffraction (SAED) patterns of (a) the initial GO, (b) rGO-Br, (c) rGO-Am.
More comprehensive information on the morphology of the initial GO and functionalized graphenes was obtained by the means of the new approach developed by Kirilenko et al.48 based on the analysis of electron diffraction tilt series to determine the graphene nanorelief. The slope of the diffraction spot intensity dependence on the reciprocal space applicate square variation measured as g2 corresponds to the average square of the graphene sheet corrugation amplitude (more details are in Supporting Information and at the reference). Applying this method, we have found that functionalization leads to some increase of the corrugation amplitude (Fig. 3a) that results from local structural distortions caused by the bonded species. As seen from this figure, even though the concentration of functional groups on the basal plane in the case of rGO-Br and rGO-Am is substantially lower than that in the initial GO, out-of-plane distortion of the graphene layer in the modified graphenes is even higher (0.19 nm and 0.18 for brominated and aminated graphenes, respectively, which slightly exceed 0.16 nm value for the initial GO). This fact can be explained in terms of compensation of graphene net bonds distortion in GO by the opposite orientation of adjacent hydroxyl and epoxide groups with respect to the graphene net49. At the same time in rGO-Br and rGO-Am bromine and amine moieties are located separately and thus result in significant out of plane dislocation of carbon atoms and corrugation of graphene net.

(a) (100) diffraction spot intensity logarithm versus reciprocal space applicate. The corresponding slopes are related to the average square of the sheet corrugation amplitude. The plots were vertically offset for clarity. Inset – the corresponding electron diffraction refluxes. (b) Raman spectra of the GO, rGO-Br and rGO-Am samples recorded using a 532-nm laser.
The case of double-layered structures appears to be of even more interest. In general, when graphene and graphene oxide layers are stacked with each other they become flatter and the measured average corrugation amplitude significantly decreases50,51. In opposite, the studied functionalized graphenes show different behavior. The stacking of the sheets is obstructed by the functional groups what, in turn, leads to the formation of multiple knolls. As seen in Fig. 3a, in rGO-Br these knolls have the height of 0.21 nm, whereas in rGO-Am this value is 1.5 times higher and is determined to be 0.32 nm. Seemingly, knoll height should be defined by a molecular size of a functional group. However, C-Br and C-NH2 molecular sizes are almost the same, 0.194 and 0.197 nm respectively. We assume that higher knoll height is related to stronger electrostatic repulsion between the amine group and second graphene layer, resulting in its stronger bending and larger knoll height.
Figure 3b presents the Raman spectra of the initial GO and modified graphenes. Two major bands are commonly observed in graphene-related materials: G band at 1580 cm−1 originating from the in-plane stretching of the graphene lattice and D band at 1345 cm−1 caused by lattice disorder, particularly distortion of carbon bonds and corrugation of graphene net, as well as GO-rGO platelets edges52,53. In the GO Raman spectrum G band is broadened and shifted from 1580 cm−1 to 1605 cm−1 due to oxidation of the graphene net. At the same time, in the case of rGO-Br and rGO-Am two peaks at 1580 cm−1 and 1605 cm−1 are simultaneously presented in the Raman spectra, indicating restoration of sp2-conjugated graphene network along with the presence of localized areas functionalized with bromine or amine moieties. Functionalization also results in a slight rise of D band intensity, with the increase of ID/IG relation from ~1 for the initial GO to 1.12 and 1.17 for the rGO-Br and rGO-Am, respectively. Considering both the aforementioned absence of observable defects and results of the electron diffraction studies the indicated rise of the D band is likely to originate from the distortion of the graphene network due to the provided covalent grafting. Both rGO-Am and rGO-Br also present three second order bands of medium intensity: 2D band (2685 cm−1), D + D′ band (2935 cm−1) and 2D′ band (3202 cm−1). The appearance of these bands is related to the interaction of the incorporated bromine and amine moieties in the double resonant processes that involve two phonons and was observed earlier for the aminated graphene24.
The morphology of the obtained aminated graphenes was also studied by scanning electron microscopy (SEM) at various scales. Regardless of the solvent type used during the deposition process, which was varied from the polar ones (isopropyl alcohol) to non-polar solvents (trichloromethane and tetrachloromethane), rGO-Am platelets display a wrinkled and twisted structure (Fig. 4a). This results in the reduction of the π-π* interlayer stacking and leads to the formation of films, exhibiting irregular porous network structure (Fig. 4b). The morphological features of rGO-Am films also appear in NK edge XAS spectra, in which the absence of angular dependence of π*-resonances is observed, asserting isotropic nature of the studied sample (Supplementary Fig. S6).
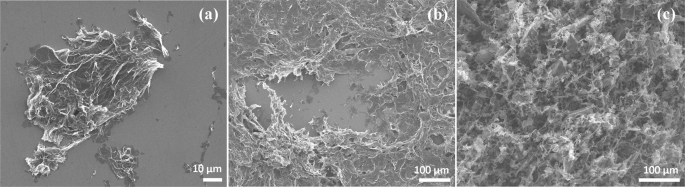
SEM images of rGO-Am (a) individual platelets, (b) multilayer film deposited on the Si wafer and (c) aerogel obtained by lyophilization of rGO-Am dioxane suspension.
To further facilitate the porous network arrangement lyophilization of rGO-Am dioxane suspension was carried out, resulting in the formation of aminated graphene aerogel (Fig. 4c). The Brunauer-Emmett-Teller (BET) specific surface area of the formed aerogel determined by N2 adsorption experiments has been measured to be ~265 m2g−1. This value is lower than those achieved in formation of the structured GO and rGO aerogels54, but still sufficiently high for rGO-Am applications in the catalysis and adsorption of metallic or dye pollutants55.
It is worth noting that despite the rGO-Am films contain many voids, cracks, and ripples due to the corrugation of the graphene layer, SEM studies of the arrays of individual rGO-Am platelets reveal that the applied modification procedure does not lead to tearing and reduction of the lateral size of GO platelets. The obtained SEM images demonstrate (Supplementary Fig. S7) that the rGO-Am individual platelets are of the same scale as the initial GO platelets (10–40 μm) and the size distributions of these materials are almost equal.
Chemical reactivity of the aminated graphene
The formation of primary amines via the applied procedure and their chemical reactivity were further analyzed by a chemical test based on the reaction between rGO-Am and 3-Chlorobenzoyl chloride. This organic compound carries acyl chloride functional group, -COCl, known to react readily with primary amines forming covalent bond: so-called amide coupling56. This reaction commonly applied for covalent modification of amine-containing materials with species and nanocarbon structures, carrying carboxyl groups (-COOH), which can be transformed to acyl chloride moieties by the treatment with thionyl chloride (SOCl2), phosphorus trichloride (PCl3), or phosphorus pentachloride (PCl5)57,58. Thus, the chosen test reaction allows to demonstrate the feasibility of rGO-Am covalent grafting with various biomolecules, dyes, functionalized nanocarbon materials, etc.
To check whether the modification of rGO-Am by 3-Chlorobenzoyl chloride successfully proceeded the series of additional XPS measurements were performed. Figure 5a demonstrates the XPS survey spectra of the rGO-Am sample prior to and after the test reaction (rGO-Am-Benz). Thanks to the presence of second chlorine, which is not taking part in the amide coupling, the successful covalent bonding between the aminated graphene and 3-Chlorobenzoyl chloride is unambiguously seen from the appearing of Cl2s peak at ~272 eV and Cl2p doublet around ~200 and 202 eV. This is additionally verified by high-resolution Cl2p spectrum (Fig. 5b), where peaks at 200.4 eV (2p3/2) and 201.9 eV (2p1/2) related to the C-Cl bonds59 are observed. The chlorine concentration calculated from the XPS survey spectrum is ~2.8 at.%. Since as it was earlier estimated the concentration of amine groups is ~4 at.%, the efficiency of the performed amide coupling appears to be about 74% determined as a relation between the concentration of bonded chlorine and the presented amines. Besides the XPS results, rGO-Am covalent grafting by the 3-Chlorobenzoyl chloride is also indicated by the obtained FTIR spectrum (Supplementary Fig. S8), where a set of characteristic bands at 740 cm−1, 1170 cm−1, 1565 cm−1, 1660 cm−1 and 3220 cm−1 related to the amide bonding arise. Thus, the obtained results confirm the presence of chemically reactive primary amines. Additionally, the thermal stability of the aminated graphene was analyzed, as amines are known to easily convert in pyridines and pyrroles upon heating36. During the purification from the unreacted 3-Chlorobenzoyl chloride, the samples were heated up to 150 °C for 3 hours. The deconvolution and further analysis of the then-obtained N1s spectra (Fig. 5c) demonstrate that the suggested modification of rGO-Am samples does not significantly affect their chemical composition and relative concentration of the amine groups still remains to be ~72%, while the concentrations of pyridines and graphitic nitrogen appear to be about 13% and 15%, respectively.

(a) XPS survey spectra of the rGO-Am films prior to and after test covalent modification with 3-Chlorobenzoyl chloride (rGO-Am-Benz). High-resolution (b) Cl2p and (c) N1s XPS spectra of rGO-Am-Benz sample.
The chemical reactivity of the rGO-Am was also verified by the test reaction of its influence on the CuCl oxidation to CuCl2. 200 mg of CuCl was dispersed in 20 ml of 1 M HCl and the obtained solution was divided into two parts. The first one was left stirring in the air and the second half of the solution was mixed with 50 mg of the aminated graphene and rigorously stirred for two hours. In the HCl medium CuCl is unstable and is known to transform into CuCl2 with the presence of Cu2+ and Cl− ions in the mixture. Depending on the concentration of Cl− ions the obtained solution is either yellow (Cl− to Cu2+ is about 2:1), green (high concentration of the Cl− ions) or blue (low concentration of Cl- ions). Amines from the rGO-Am are weak bases, which should interact with the Cl− ions and, thus, reduce their content in the solution, leading to the blue color of the resulting solution. Indeed, this effect we observed in the case of the mixture with the addition of rGO-Am (Supplementary Fig. 9) with the retention of the CuCl + HCl solution without rGO-Am green. The observed blue color of the resulting solution can also be related to the hydrolysis of the amine groups from the rGO-Am in the aqueous medium and formation of a tetraamine copper hydroxide complex, which also induces the blue colouring of the mixture. Thus, the performed reaction additionally demonstrates the presence of chemically active amines in the obtained rGO-Am material.
Electronic properties
Besides changing of graphene chemical reactivity the presence of amines, analogously to other nitrogen species, substantially affects the electronic properties of graphene22,60,61. Particularly, it is expected that the rGO-Am samples due to their n-doping61 can demonstrate a noticeable increase in the conductivity as compared to the samples of pristine rGO with the same reduction degree (Supplementary Fig. S2). Figure 6 presents the voltage (V) versus current (I) characteristics plot of rGO-Br, rGO-Am and rGO-HT films. The V vs. I data show a linear behavior for all the samples, confirming the good Ohmic contact between the film and electrodes. The sheet resistance and electrical conductivity calculated considering the films geometry and averaged over several measurements are summarized in Table 2. As seen, rGO-Am shows 2 times higher conductivity than that in pristine rGO-HT, 270 S/m and 134 S/m, respectively. This confirms the N-doping effect from the amine groups. At the same time, rGO-Br conductivity is almost 4 times lower due to a lower degree of graphene basal plane reduction.

I-V curves of rGO-Br, rGO-Am and rGO-HT samples.
To explore the effect of the functionalization with amine groups on the electronic structure of graphene, valence band spectra of the initial GO, rGO-HT, and rGO-Am using a photon at 130 eV were measured (Fig. 7). All the spectra are dominated by a broad band centered at ∼7.6 eV commonly attributed to the 2p-σ electron states of graphene net62. Additionally, broad features at 26–28 eV, corresponding to σ electronic states in carboxyls and carbonyls are presented, indicating their presence in all samples what coincides with XPS data. At the same time, significant differences are observed in the range 0–6 eV. In the initial GO spectrum noticeable peak at ~5.5 eV corresponding to 2p π-σ overlap states, related to C-O bonds formation63. This assignment is justified by the observed diminishing of this feature in the valence band spectra of both rGO-Am and rGO-HT, where most part of the oxygen-containing functional groups are eliminated. Furthermore, close to zero density of states (DOS) is observed between Fermi level and ~2.2 eV in the case of GO, indicating the presence of band gap of ~4.5 eV which is in a good agreement with the published data64. On the contrary, both rGO-HT and rGO-Am demonstrate non-zero DOS in the region from 3 to 0 eV as a result of the increase of C2p-π electron content due to enlargement of the π -conjugated polyaromatic sp2-domains during the GO reduction. In rGO-HT VB spectrum peak at ~3.2 eV corresponding to C 2p-π states is more distinguishable compared to the one in rGO-Am suggesting the more complete restoration of the delocalized π-conjugated system. Note, that this difference can be also attributed to the corrugated nature of rGO-Am lattice which distortion also influences the number of 2p-π electronic states. Despite this similarity between rGO-Am and rGO-HT valence band spectra, several bands related to the introduction of the nitrogen species appear in the former one. Particularly, the bands at ~5.0 eV and ~7.3 eV, corresponding to electronic states of N lone pair and the delocalized C–N π bonds can be distinguished in the rGO-Am valence band spectra65,66. Moreover, slight changes in the density of states near 2.3 eV arise due to the states related to C–C and C–N π bonds, existing in a planar sp2-graphene structure67. Finally, a broad peak centered between 18 and 20 eV can be observed after amination. While studying N-doped HOPG Favaro et al.68 have discovered the appearance of such a feature in the VB spectra of HOPG upon its N implantation and assumed that it originates from the presence of the –CN groups. Considering the absence of this peak in the spectrum of the rGO-HT sample and following Favaro et al. we assume that it is related to the electronic states arising due to the incorporated amines.

(a) Valence band spectra and (b) secondary electron energy cutoff spectra of the initial GO, rGO-Am and rGO-HT. Ef line corresponds to the position of Fermi level. The Fermi level position is referred at binding energy 0 eV. All the spectra were aligned considering the energy shift due to charging effect.
The effect of the amine functionalization on the graphene work function (WF) has also been studied (Fig. 7). The work functions of GO, rGO-HT and rGO-Am samples were determined using a standard approach based on subsequent measuring of the valence band and corresponding secondary electrons (SE) cut-off spectra (Fig. 7a,b, respectively). In this case, the value of work function, usually denoted as eΦm, can be calculated using the following equation: eΦm = hν – (EF – ESEC), where hν = 130 eV is the photons energy, EF and ESEC are the positions of Fermi level and cut-off threshold both represented in the kinetic energy scale69. The obtained in such a way eΦm values are represented in the Fig. 7b and equal respectively to ~4.2 eV for rGO-Am, to ~4.7 for rGO-HT and to ~5.1 eV for initial GO. It is worth noting that the value of the rGO-HT work function (~4.7 eV) is in a very good consistency with the literature data70,71. On the contrary, the value of the work function of initial GO (~5.1 eV) appears to be somewhat higher the typical values (~4.9 eV) obtained by other groups71,72, probably due to the higher degree of graphene oxidation in our case.
Interestingly, the SE spectrum of rGO-Am demonstrates the presence of two slopes indicating that the surface of this sample consists of two types of domains. The work function of first type domains has the value of ~4.2 eV, while for second type domains it becomes very close to the work function of the rGO-HT sample (~4.65 eV). This fact points out the substantial local decrease of the rGO-Am work function reaching the value of ~0.5 eV (see Fig. 7b). The primary amines located along the edges and wrinkles of graphene platelets are the electron-donating moieties, and, as that, have to cause some decrease in the rGO work function72,73. Hence, the observed decrease in rGO-Am work function may be attributed to the contribution of the amines as well as pyridines, which both form a noticeable amount of rGO domains with the lower value of eФm.
Conclusion
In summary, the approach for scalable production of the aminated graphene from graphene oxide is developed. The proposed method leads to the reduction of graphene and subsequent incorporation of up to 4 at.% of amines with low content of other nitrogen species (pyridines and graphitic N) as indicated by XPS and XAS data. Note, that the amination efficiency can be further enhanced by increasing Br concentration via modification of the bromination method. Both TEM and SEM studies revealed that due to the presence of amines and elimination of oxygen functional groups, the aminated graphene exhibits complicated morphology with a tendency to form wrinkled and corrugated structure. This facilitates the formation of the porous films and aerogels from the obtained aminated graphene, making it perspective for electrocatalyst and sensing applications. The use of the aminated graphene in biosensing applications, particularly aptasensors manufacturing, is further enhanced by its chemical reactivity through amide coupling what is emphasized by the successful covalent linking of 3-Chlorobenzoyl chloride to the obtained material. In addition, the amination increases the conductivity of graphene layers and alters its valence band structure and work function that is of interest not only for optoelectronic and photovoltaic applications but also for the study properties of variously functionalized graphenes.
Methods
GO synthesis and chemical modification
Graphene oxide was synthesized by the Hummers method74. Graphite powder (4 g) was oxidized by using concentrated H2SO4, KMnO4 and 30% H2O2 solution. No nitrates were used to prevent nitrogen doping of graphene oxide during the synthesis. The rest of the GO preparation procedure is analogous to that described in our previous work30 and its main steps are as follows. The resulting mixture was centrifuged at 3500 rpm for 1 hour, and the supernatant was decanted away. The remaining material was additionally centrifuged at 1500 rpm for 10 min to obtain aqueous GO suspension as a supernatant. Sonication was excluded throughout the whole process to prevent damaging of graphene oxide flakes and obtain suspensions with GO flakes lateral size up to 100 μm.
Graphene oxide bromination was performed as follows. The GO aqueous suspension (0.05 wt.%) was centrifugated (18186 g, 15 minutes), the supernatant was decanted away. After that, HBr acid (46%, Sigma-Aldrich) was added to the sediment and suspension was intensively shacked for 60 seconds. The described procedure was repeated three times and the finally obtained suspension was stirred using magnetic stirrer during 20 hours in closed flask. The obtained brominated graphene was copiously washed with centrifugation (18186 g, 25 minutes) and rinsing the obtained sediment with organic solvent by mechanical stirrer (5 minutes stirring). This procedure was repeated 5 times. During the first 2 cycles chloroform was used as a solvent and in the last 3 cycles it was changed to the isopropyl alcohol.
Amination was carried out by centrifugation (18186 g, 15 minutes) of rGO-Br isopropyl alcohol suspension (0.05 wt.%), decanting the supernatant away and rinsing the sediment by a saturated solution of ammonia in isopropyl alcohol. The described procedure was repeated 3 times. The washing procedure is the same as in the case of rGO-Br synthesis.
Covalent modification of rGO-Am by 3-Chlorobenzoyl chloride was performed as follows. rGO-Am was filtered using a glass filter and 3 times washed with acetonitrile. Afterwards, 50 mg of rGO-Am was dispersed in 10 ml of acetonitrile and 100 μl of triethanolamine and 50 μl of 3-Chlorobenzoyl chloride were added while stirring. The obtained suspension was further stirred for one hour in a closed flask. The as-prepared suspension was filtered using glass filter with subsequent washing using acetonitrile, deionized water, ethyl alcohol, and chloroform.
Characterization of the initial GO and the obtained modified graphenes
A set of characterization techniques was exploited similarly to the used in the aforementioned work30 with some extensions concerning the study of the aminated and brominated materials as follows. Measurements using X-ray photoelectron spectroscopy (XPS) were made using Thermo Fisher ESCALAB 250Xi XPS system equipped with an Al Kα X-ray source providing 1486.6 eV line. Calibration of the spectra was performed using the Au 4f7/2 line at 84.0 eV as a reference. Effect of surface charging of low-conducting GO surface was treated by aligning of XPS spectra according to the C1s line at 284.6 eV of a conductive rGO-HT (see Supplementary Fig. S2). CasaXPS software was used for quantification and fitting of the XPS spectra. Nonlinear least-squares routine was used for the χ2 minimization. Shimadzu-2450 spectrophotometer was used for the UV-vis absorption spectra acquisition from the studied samples. Fourier transform infrared spectroscopy was performed on the Infralum-08 FTIR spectrometer equipped with the attenuation of total reflectance attachment. Horiba Jobin-Yvon LabRam HR800 apparatus equipped with a Laser Quantum Torus 532-nm laser having 50 mW of the output power was used for Raman spectroscopy. The excitation source was attenuated with an optical density 1 filter condensed by a 20x lens to a 30 µm spot. The light power at the sample was 0.11 mW. The set of five Raman spectra were obtained in different spots of the studied samples and further averaged to provide reliable data. Measurements of electrical conductivity in the GO, rGO-Br and rGO-Am samples were performed using a two-electrode system. Thin films of the studied material were obtained by casting a drop of the corresponding suspension onto quartz substrates with two comb 80 nm thick Au electrodes with 500 µm separation prepared on them. The electrode comb included 8 electrode bar pairs (Supplementary Fig. S10).
N-K edge X-ray absorption spectra (XAS), Valence band spectra and Work function spectra were recorded at the Russian-German beamline of electron storage ring BESSY-II (Helmholtz-Zentrum Berlin) using the beamline ultrahigh vacuum experimental station75. The XAS measurements were performed in the total electron yield (TEY) mode realized by sweeping the incident photon energy and simultaneously recording the sample drain current. The thus-obtained TEY XAS spectra were then subjected to appropriate normalization and smoothing.
Structural characterization was mainly performed analogously to that presented in our previous work30 with some differences as can be seen in the following. X-ray diffraction (XRD) technique was implemented using Bruker Smart Apex Duo set-up equipped with a CuKα source and an Apex 2D detector. Sample for these studies was prepared by the fixation of a material portion on a cactus needle end by a nitrocellulose lacquer. Then a series of diffraction patterns were acquired at various incidence angles (of the X-ray beam incidence on the detector), and the obtained 2D data was recalculated to the means of 2θ scan. DIFFRAC.EVA (Bruker Cor.) software was used for the obtained diffraction curves analysis based on the data from Powder Diffraction File ICCD PDF-2 release [JCPDS-International Centre for Diffraction Data (http://www.icdd.com)]. The transmission electron microscopy including electron diffraction (ED) studies were performed on a JEM ARM200F cold FEG probe and image aberration corrected electron microscope equipped with a large solid-angle CENTURIO EDX detector, Gatan GIF QUANTUM, and ORIUS CCD camera and Jeol JEM-2100F microscope. TEM sample was prepared by wetting a TEM-grid with carbon lacey film in a diluted water dispersion of the studied material. Jeol JSM-7001F microscope was used for SEM studies. Langmuir−Blodgett method was exploited for monolayer films formation in a way described elsewhere76. AFM images were obtained using Veeco Dimension 3100 atomic force. Operation in tapping mode using RTESP probes was used for surface morphology and thickness of the rGO-Am films determination.
Specific surface area was measured by Brunauer-Emmett-Teller (BET) method. Immediately prior to the measurements, the sample of rGO-Am was preheated to 180 °C and kept at this temperature for an hour in a vacuum to remove any products that could be adsorbed on the highly developed surface of the sample.
References
Sturala, J., Luxa, J., Pumera, M. & Sofer, Z. Chemistry of Graphene Derivatives: Synthesis, Applications, and Perspectives. Chem. Eur. J. 24, 5992–6006 (2018).
Dasari, B. L., Nouri, J. M., Brabazon, D. & Naher, S. Graphene and derivatives – Synthesis techniques, properties and their energy applications. Energy 140, 766–778 (2017).
Xu, Y. & Shi, G. Assembly of chemically modified graphene: methods and applications. J. Mater. Chem. 21, 3311–3323 (2011).
Eigler, S. & Hirsch, A. Chemistry with Graphene and Graphene Oxide – Challenges for Synthetic Chemists. Angew. Chem. Int. Ed. 53, 2–21 (2014).
Karlicky, F., Datta, K. K. R., Otyepka, M. & Zboril, R. Halogenated Graphenes: Rapidly Growing Family of Graphene Derivative. ACS Nano 7, 6434–6464 (2013).
Rummeli, M. H. et al. Graphene: Piecing it Together. Adv. Mater. 23, 4471–4490 (2011).
Hunt, A., Kurmaev, E. Z. & Moewes, A. Band gap engineering of graphene oxide by chemical modification. Carbon 75, 366–371 (2014).
Deka, M. J., Dutta, A. & Chowdhury, D. Tuning the wettability and photoluminescence of graphene quantum dots via covalent modification. New J. Chem. 42, 355–362 (2018).
Rabchinskii, M. K. et al. Nanoscale perforation of graphene oxide during photoreduction process in the argon atmosphere. J. Phys. Chem. C 120, 28261–28269 (2016).
Kulia, T. et al. Chemical functionalization of graphene and its applications. Prog. Mater. Sci. 57, 1061–1105 (2012).
Baraket, M. et al. Aminated graphene for DNA attachment produced via plasma functionalization. Appl. Phys. Lett. 100, 233123 (2012).
Suvarnaphaet, P. & Pechprasarn, S. Graphene-Based Materials for Biosensors: A Review. Sensors 17, 2161 (2017).
Kang, M.-A. et al. Highly sensitive and wearable gas sensors consisting of chemically functionalized graphene oxide assembled on cotton yarn. RSC Adv. 8, 11991–11996 (2018).
Hernandez, Y. et al. High-yield production of graphene by liquid-phase exfoliation of graphite. Nat Nanotechnol. 3, 563–568 (2008).
Zhan, D. et al. Electronic structure of graphite oxide and thermally reduced graphite oxide. Carbon 49, 1362–1366 (2011).
Dreyer, D. R., Park, S., Bielawski, C. W. & Ruoff, R. S. The chemistry of graphene oxide. Chem. Soc. Rev. 39, 228–240 (2010).
Dong, L., Yang, J., Chhowalla, M. & Loh, K. P. Synthesis and reduction of large sized graphene oxide sheets. Chem. Soc. Rev. 46, 7306–7316 (2017).
Chua, C. K. & Pumera, M. Chemical reduction of graphene oxide: a synthetic chemistry viewpoint. Chem. Soc. Rev. 43, 291–312 (2014).
Mazanek, V. et al. Tuning of fluorine content in graphene: towards large-scale production of stoichiometric fluorographene. Nanoscale 7, 13646–13655 (2015).
Zhou, C. et al. Graphene’s cousin: the present and future of graphane. Nanoscale Res. Lett. 9, 26 (2014).
Semenov, K. N. et al. Carboxylated fullerenes: Physico-chemical properties and potential applications. Prog. in Solid State Chem. 47-48, 19–36 (2017).
Marsden, A. J. et al. Effect of oxygen and nitrogen functionalization on the physical and electronic structure of graphene. Nano Res. 8, 2620–2635 (2015).
Valentini, L. et al. Use of butylamine modified graphene sheets in polymer solar cells. J. Mater. Chem. 20, 995–1000 (2010).
Zhang, W. et al. Preparation of amino-functionalized graphene oxide by Hoffman rearrangement and its performances on polyacrylate coating latex. Prog. Org. Coat. 94, 9–17 (2016).
Krasteva, N. et al. Aminated Graphene Oxide as a Potential New Therapy for Colorectal Cancer. Oxid. Med. Cell Longev. 2019, 3738980 (2019).
Chen, P. et al. Hydrothermal synthesis of macroscopic nitrogen-doped graphene hydrogels for ultrafast supercapacitor. Nano Energy 2, 249–256 (2013).
Long, D. et al. Preparation of Nitrogen-Doped Graphene Sheets by a Combined Chemical and Hydrothermal Reduction of Graphene Oxide. Langmuir 26, 16096–16102 (2010).
Guo, H.-L., Su, P., Kang, X. & Ning, S.-K. Synthesis and characterization of nitrogen-doped graphene hydrogels by hydrothermal route with urea as reducing-doping agents. J. Mater. Chem. A 1, 2248–2255 (2013).
Aguilar-Bolados, H. et al. Facile and Scalable One-step Method for Amination of Graphene Using Leuckart Reaction. Chem. Mater. 29, 6698–6705 (2017).
Rabchinskii, M. et al. Facile reduction of graphene oxide suspensions and films using glass wafers. Sci. Rep. 8, 14154 (2018).
Li, Y. et al. Synthesis of partially hydrogenated graphene and brominated graphene. J. Mater. Chem. 22, 15021–15024 (2012).
Jankovsky, O. et al. Towards graphene bromide: bromination of graphite oxide. Nanoscale 6, 6065 (2014).
Zheng, J. et al. Production of Graphite Chloride and Bromide Using Microwave Sparks. Sci. Rep. 2, 662 (2012).
Batra, N., Vandana, Praveen, K., Srivastava, S. K. & Singh, P. K. X-ray photoelectron spectroscopic study of silicon surface passivation in alcoholic iodine and bromine solutions. J. Renew. Sustain. Energy. 6, 013121 (2014).
Tao, H. et al. N-doping of graphene oxide at low temperature for oxygen reduction reaction. Chem. Commun. 53, 873–876 (2017).
Schultz, B. J. et al. X-ray absorption spectroscopy studies of electronic structure recovery and nitrogen local structure upon thermal reduction of graphene oxide in an ammonia environment. RSC Adv. 4, 634–644 (2014).
Jansen, R. J. J. & van Bekkum, H. XPS of nitrogen-containing functional groups on activated carbon. Carbon 33, 1021–1027 (1995).
Acik, M. et al. Unusual infrared-absorption mechanism in thermally reduced graphene oxide. Nat. Mater. 9, 840–845 (2010).
Wang, X. & Gilham, J. K. Competitive Primary Amine/ Epoxy and Secondary Amine/ Epoxy Reactions: Effect on the Isothermal Time-to-Vitrify. J. Appl. Polym. Sci. 43, 2267–2277 (1991).
Qin, H. et al. Chemical Amination via Cycloaddition of Graphene for Use in a Glucose Sensor. J. Nanosci. Nanotechnol. 16, 5034–5037 (2016).
Blume, R. et al. The influence of intercalated oxygen on the properties of graphene on polycrystalline Cu under various environmental conditions. Phys. Chem. Chem. Phys. 16, 25989–26003 (2014).
Fan, X. B. et al. Deoxygenation of exfoliated graphite oxide under alkaline conditions: a green route to graphene preparation. Adv. Mater. 20, 4490–4493 (2008).
Darmstadt, H. & Roy, C. Surface spectroscopic study of basic sites on carbon blacks. Carbon 41, 2662–2665 (2003).
Cheung, T. T. P. X‐ray photoemission of carbon: Lineshape analysis and application to studies of coals. J. Appl. Phys. 53, 6857–6862 (1982).
Perera, S. D. et al. Alkaline deoxygenated graphene oxide for supercapacitor applications: An effective green alternative for chemically reduced graphene. J. Power Sources 215, 1–10 (2012).
Guex, L. G. et al. Experimental review: chemical reduction of graphene oxide (GO) to reduced graphene oxide (rGO) by aqueous chemistry. Nanoscale 9, 9562–9571 (2017).
Wang, B. et al. Chemical amination of graphene oxides and their extraordinary properties in the detection of lead ions. Nanoscale 3, 5059 (2011).
Kirilenko, D. A. & Brunkov, P. N. Measuring the height-to-height correlation function of corrugation in suspended graphene. Ultramicroscopy 165, 1–7 (2016).
Boukhvalov, D. W. & Katsnelson, M. I. Modeling of Graphite Oxide. J. Am. Chem. Soc. 130, 10697–10701 (2008).
Kirilenko, D. A., Dideykin, A. T. & van Tendeloo, G. Measuring the corrugation amplitude of suspended and supported graphene. Phys. Rev. B. 84, 235417 (2011).
Thomsen, J. et al. Suppression of intrinsic roughness in encapsulated graphene. Phys. Rev. B 96, 014101 (2017).
Kudin, K. N. et al. Raman spectra of graphite oxide and functionalized graphene sheets. Nano Lett. 8, 36 (2008).
Sreeprasad, T. S., Samal, A. K. & Pradeep, T. Tellurium Nanowire-Induced Room Temperature Conversion of Graphite Oxide to Leaf-like Graphenic Structures. J. Phys. Chem. C 113, 1727–1737 (2009).
Wang, C. et al. Freeze-Casting Produces a Graphene Oxide Aerogel with a Radial and Centrosymmetric Structure. ACS Nano 12, 5816–5825 (2018).
Liu, Y. et al. Aminated Graphene Oxide Impregnated with Photocatalytic Polyoxometalate for Efficient Adsorption of Dye Pollutants and Its Facile and Complete Photoregeneration. Small 13, 1603174 (2017).
Dunetz, J. R., Magano, J. & Weisenburger, G. A. Large-Scale Applications of Amide Coupling Reagents for the Synthesis of Pharmaceuticals. Org. Process Res. Dev. 20, 140–177 (2016).
Eitan, A., Jiang, K., Dukes, D., Andrews, R. & Schadler, L. S. Surface Modification of Multiwalled Carbon Nanotubes: Toward the Tailoring of the Interface in Polymer Composites. Chem. Mater. 15, 3198–3201 (2003).
Yan, W., Seifermann, S. M., Pierrat, P. & Bräse, S. Synthesis of highly functionalized C60 fullerene derivatives and their applications in material and life sciences. Org. Biomol. Chem. 13, 25–54 (2015).
Li, B. et al. Photochemical Chlorination of Graphene. ACS Nano 5, 5957–5961 (2011).
Usachov, D. et al. Nitrogen-Doped Graphene: Efficient Growth, Structure, and Electronic Properties. Nano Lett. 11, 5401–5407 (2011).
Granzier-Nakajima, T., Fujisawa, K., Anil, V., Terrones, M. & Yeh, Y.-T. Controlling Nitrogen Doping in Graphene with Atomic Precision: Synthesis and Characterization. Nanomaterials 9, 425 (2019).
Bianconi, A., Hagstrom, S. B. M. & Bachrach, R. Z. Photoemission studies of graphite high-energy conduction-band and valence-band states using soft-x-ray synchrotron radiation excitation. Phys. Rev. B 16, 5543 (1977).
Sutar, D. S., Singh, G. & Botcha, V. D. Electronic structure of graphene oxide and reduced graphene oxide monolayers. Appl. Phys. Lett. 101, 103103 (2012).
Hsu, H.-C. et al. Graphene oxide as a promising photocatalyst for CO2 to methanol conversion. Nanoscale 5, 262–268 (2013).
Hammer, P., Lacerda, R. G., Droppa, R. Jr. & Alvarez, F. Comparative study on the bonding structure of hydrogenated and hydrogen free carbon nitride films with high N content. Diamond Relat. Mater. 9, 577–581 (2000).
Luo, Z. et al. Pyridinic N doped graphene: synthesis, electronic structure, and electrocatalytic property. J. Mater. Chem. 21, 8038 (2011).
Chen, Z. Y., Zhao, J. P., Yano, T. & Ooie, T. Valence band electronic structure of carbon nitride from x-ray photoelectron spectroscopy. J. Appl. Phys. 92, 281 (2002).
Favaro, M. et al. A synchrotron-based spectroscopic study of the electronic structure of N-doped HOPG and PdY/N-doped HOPG. Surf. Sci. 646, 132–139 (2016).
Helander, M. G., Greiner, M. T., Wang, Z. B. & Lu, Z. H. Pitfalls in measuring work function using photoelectron spectroscopy. Appl. Surf. Sci. 256, 2602–2605 (2010).
Kang, B., Lim, S., Lee, W. H., Jo, S. B. & Cho, K. Work-Function-Tuned Reduced Graphene Oxide via Direct Surface Functionalization as Source/Drain Electrodes in Bottom-Contact Organic Transistors. Adv. Mater. 25, 5856–5862 (2013).
Naito, K., Yoshinaga, N., Matake, S. & Akasaka, Y. Work-function decrease of transparent conducting films composed of hydrazine-reduced graphene oxide and silver nanowire stacked layers by electrochemical treatment. Synthetic Metals 195, 260–265 (2014).
Becerril, H. A. et al. Fabrication and Evaluation of Solution-Processed Reduced Graphene Oxide Electrodes for p- and n-Channel Bottom-Contact Organic Thin-Film Transistors. ACS Nano 4, 6343 (2010).
Ji, S. et al. Work function engineering of graphene oxide via covalent functionalization for organic field-effect transistors. Appl. Surf. Sci. 419, 252–258 (2017).
Hummers, W. S. & Offeman, R. E. Preparation of Graphitic Oxide. J. Am. Chem. Soc. 80, 1339–1339 (1958).
Molodtsov, S. L. et al. High-resolution Russian-German beamline at BESSY. Appl. Phys. A 94, 501–505 (2009).
Aleksenskii, A. E. et al. Single layer graphene oxide films on a silicon surface. Tech. Phys. 58, 1614–1618 (2013).
Acknowledgements
S.I. Pavlov and S.A. Ryzhhkov acknowledge the Russian Foundation for Basic Research (grant no. 18-29-19172) for the support of the experiments on the chemical synthesis and SEM imaging presented in sections “Chemical reactivity of the aminated graphene” and “Study of the morphological features”. N.A. Besedina thanks for financial support the SPbAU RAS state order, project 16.9790.2017/БЧ. M.K. Rabchinskii, M.V. Baidakova, D.A. Kirilenko and V.V. Shnitov work on the obtaining and processing of the TEM images, SAED patterns as well as electrical studies presented in sections “Study of the morphological features” and “Electronic properties” was supported by the grant of the Russian Science Foundation (Project No. 19-72-10052). M.V. Gudkov and V.P. Melnikov thank the Program of Fundamental Researches of the Russian Academy of Sciences (project No. 0082-2014-0014) for financial supporting. D. Yu. Stolyarova thanks for support NRC “Kurchatov Institute”. M. K. Rabchinskii, V. V. Shnitov, M. V. Baidakova, D. Yu. Stolyarova and A.V. Shvidchenko thank Russian-German Laboratory at synchrotron BESSY II (Berlin) for the support of their XPS, XAS, VB and WF measurements and Helmholtz-Zentrum Berlin (HZB) for the allocation of synchrotron radiation beamtime. The work has been carried out in the Joint Research Center ‘Materials science and characterization in advanced technology’ with financial support by Ministry of Education and Science of the Russian Federation (id RFMEFI62119X0021). The work has been carried out using Unique Scientific Equipment “Kurchatov Synchrotron Radiation Source”. The authors are grateful to Dr. Yu. V. Kulvelis and Dr. V. P. Ulin for the fruitful discussions.
Author information
Authors and Affiliations
Contributions
M.K.R. primarily designed the study and supervised the experimental research. M.K.R., S.A.R., A.V.S. and N.V.U. performed the chemical reduction, modification of GO, carried out test reactions and prepared samples for the whole series of measurements. M.V.G. and V.P.M. synthesized graphene oxide suspensions and performed the specific surface area measurements. M.K.R. carried out measurements of UV-Vis spectra. M.V.B., O.I.L. and D.A.K. obtained and processed TEM images and SAED patterns. S.I.P. obtained SEM images and performed elemental analysis. N.A.B. carried out measurements of Raman spectra and performed XRD measurements. V.V.S., D. Yu.S., D.V.P., F.R., M.B., R.G.C. and D.A.S. obtained and evaluated XPS, XAS, VB and WF spectra. S.I.P., M.V.B. and P.N.B. performed sheet resistance and electrical conductivity measurements. P.N.B. obtained AFM images. M.K.R., V.V.S. and D.A.K. co-wrote the manuscript with input from P.N.B, N.V.U. and D.Yu.S. All authors discussed the results and commented on the manuscript.
Corresponding author
Ethics declarations
Competing interests
The authors declare no competing interests.
Additional information
Publisher’s note Springer Nature remains neutral with regard to jurisdictional claims in published maps and institutional affiliations.
Supplementary information
Rights and permissions
Open Access This article is licensed under a Creative Commons Attribution 4.0 International License, which permits use, sharing, adaptation, distribution and reproduction in any medium or format, as long as you give appropriate credit to the original author(s) and the source, provide a link to the Creative Commons license, and indicate if changes were made. The images or other third party material in this article are included in the article’s Creative Commons license, unless indicated otherwise in a credit line to the material. If material is not included in the article’s Creative Commons license and your intended use is not permitted by statutory regulation or exceeds the permitted use, you will need to obtain permission directly from the copyright holder. To view a copy of this license, visit http://creativecommons.org/licenses/by/4.0/.
About this article

Cite this article
Rabchinskii, M.K., Ryzhkov, S.A., Kirilenko, D.A. et al. From graphene oxide towards aminated graphene: facile synthesis, its structure and electronic properties. Sci Rep 10, 6902 (2020). https://doi.org/10.1038/s41598-020-63935-3
Received:
Accepted:
Published:
DOI: https://doi.org/10.1038/s41598-020-63935-3
This article is cited by
-
Composites containing resins and carbon nano-onions as efficient porous carbon materials for supercapacitors
Scientific Reports (2023)
-
Applications of graphene-based tungsten oxide nanocomposites: a review
Journal of Nanostructure in Chemistry (2023)
-
Fabrication of Multifunctional PA6 Composite Fibers Based on a Synergistic Effect of Ionic Liquid Modified Carbon Nanofillers
Fibers and Polymers (2023)
-
Surface reaction for efficient and stable inverted perovskite solar cells
Nature (2022)
-
Novel Venetin-1 nanoparticle from earthworm coelomic fluid as a promising agent for the treatment of non-small cell lung cancer
Scientific Reports (2022)
Comments
By submitting a comment you agree to abide by our Terms and Community Guidelines. If you find something abusive or that does not comply with our terms or guidelines please flag it as inappropriate.
