


US STOCKS OUTLOOK:
- S&P 500 drops modestly after Tuesday’s rally on fears that the economy may be headed for a hard landing
- In a congressional testimony, Powell says that inflation risks have risen and that the Fed has the resolve to restore price stability
- S&P 500 maintains a bearish outlook from a technical and fundamental point of view
Trade Smarter - Sign up for the DailyFX Newsletter
Receive timely and compelling market commentary from the DailyFX team
Most Read: Gamma Squeeze Explained - Basic Options Theory and How it Works
After trading higher for most of the day, U.S. stocks reversed lower in late trading, finishing in negative territory, and failing to build on Tuesday’s rally, signaling little appetite among investors and traders to increase risk exposure amid mounting recession anxiety. When it was all said and done, the S&P 500 dropped 0.13% to 3,759 in a volatile session marked by the Federal Reserve chairman’s Semiannual Monetary Policy Report to Congress.
At his Senate hearing, Jay Powell offered some positive comments on the current health of the economy, but there was by no means a "dovish pivot"; instead, he maintained a very hawkish posture in the face of four-decade high CPI readings. The Fed chief warned that the risks of inflation becoming entrenched have increased, but sought to assuage concerns by stressing that the central bank has the resolve to restore price stability, a sign that policymakers will do what is necessary to tame stubbornly elevated inflationary pressures.
Despite Powell's remarks, US Treasury rates fell sharply, with the 2-year and 10-year yield retreating about 15 bp to 3.05% and 3.15% respectively. The recent drop in oil prices, coupled with growing recession fears, has traders speculating that the FOMC may fold sometime in 2023 and reverse course to avoid a deep downturn. The shift in expectations can be seen in the Fed funds futures curve, which now implies a terminal rate of 3.58% in May next year, down from 4.15% a week ago, a 57 bp reversal in less than 10 days.

FED FUNDS FUTURES IMPLIED RATE (MAY 2023 CONTRACT)
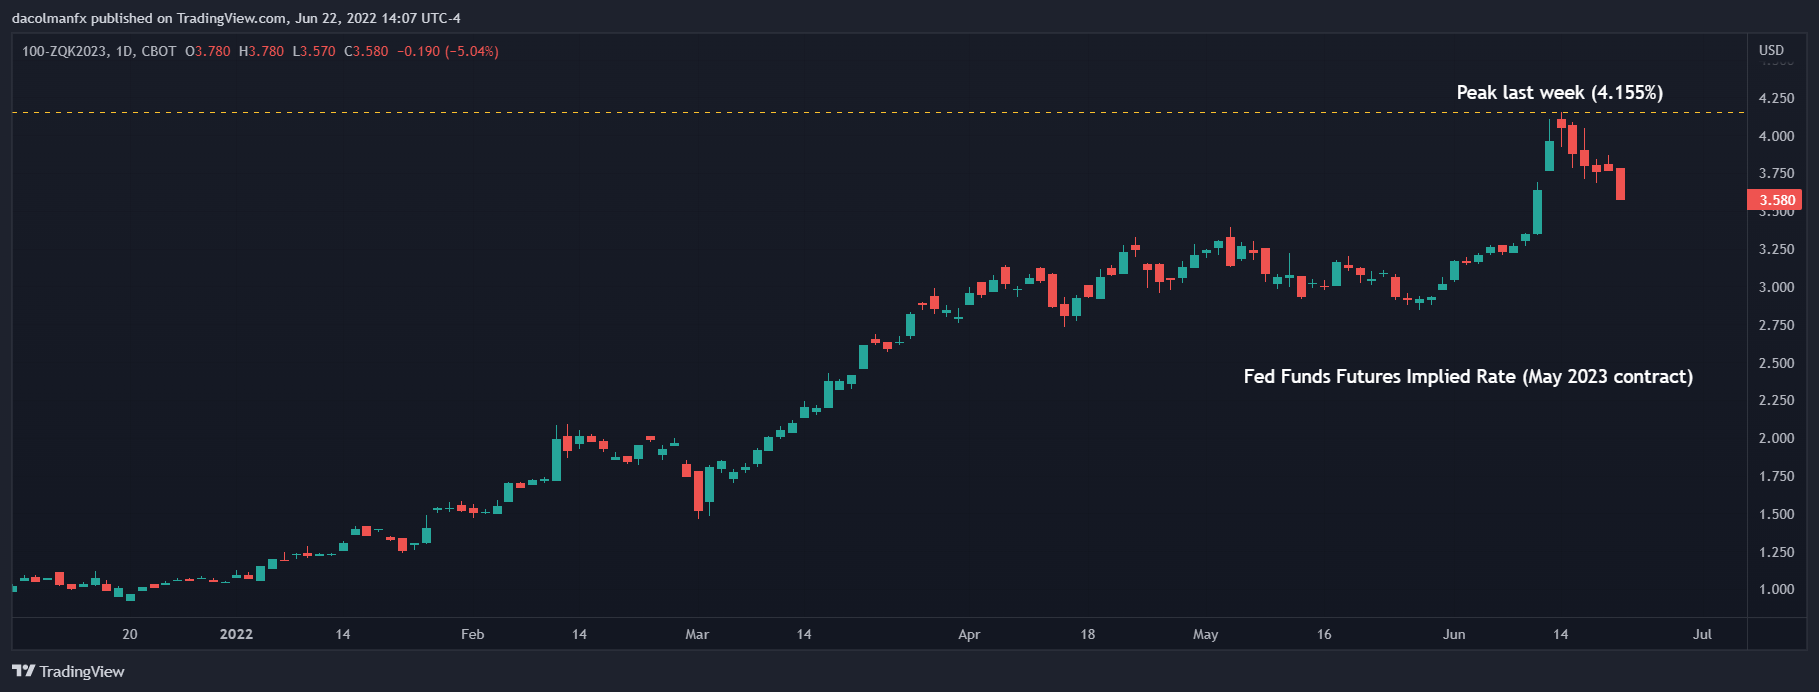
Fed Funds Futures Implied Rate Prepared Using TradingView
In terms of the outlook, the macroeconomic landscape is likely to remain challenging for equities heading into the second quarter earnings season, creating the right conditions for volatility to thrive, and come unannounced. Slowing economic growth will curtail demand, while sky-high input costs will further pressure margins, squeezing corporate profits in the coming months. In this environment, the S&P 500 will struggle to mount a meaningful recovery as rallies will continue to be sold.
Looking ahead, there is no relevant economic data on the U.S. calendar on Thursday, but there is one high-impact event to watch for. Fed Chair Powell is scheduled to appear before Congress for the second day in a row, but this time before the House Financial Services Committee.Traders should carefully scrutinize his remarks on the economy and the tightening cycle, although he is unlikely to add anything new after his lengthy Senate testimony today.
| Change in | Longs | Shorts | OI |
| Daily | 3% | -3% | 1% |
| Weekly | 16% | -18% | -2% |
S&P 500 TECHNICAL ANALYSIS
The S&P 500 plunged violently last week and established a new 2022 low, but failed to conclusively break below cluster support spanning from 3,700 to 3,665. If this floor holds in the near term, buyers may be emboldened to jump back in, but to have confidence that the worst is over, the index must rise above resistance at 3,810 and reclaim the psychological 4,000 level. On the other hand, if sellers retake control of the market and push prices below 3,700/3,665, all bets are off. Under this scenario, bearish momentum could accelerate, setting the stage for a drop towards the 3,500 area, a key support created by the 50% Fibonacci retracement of the 2020/2022 rally.
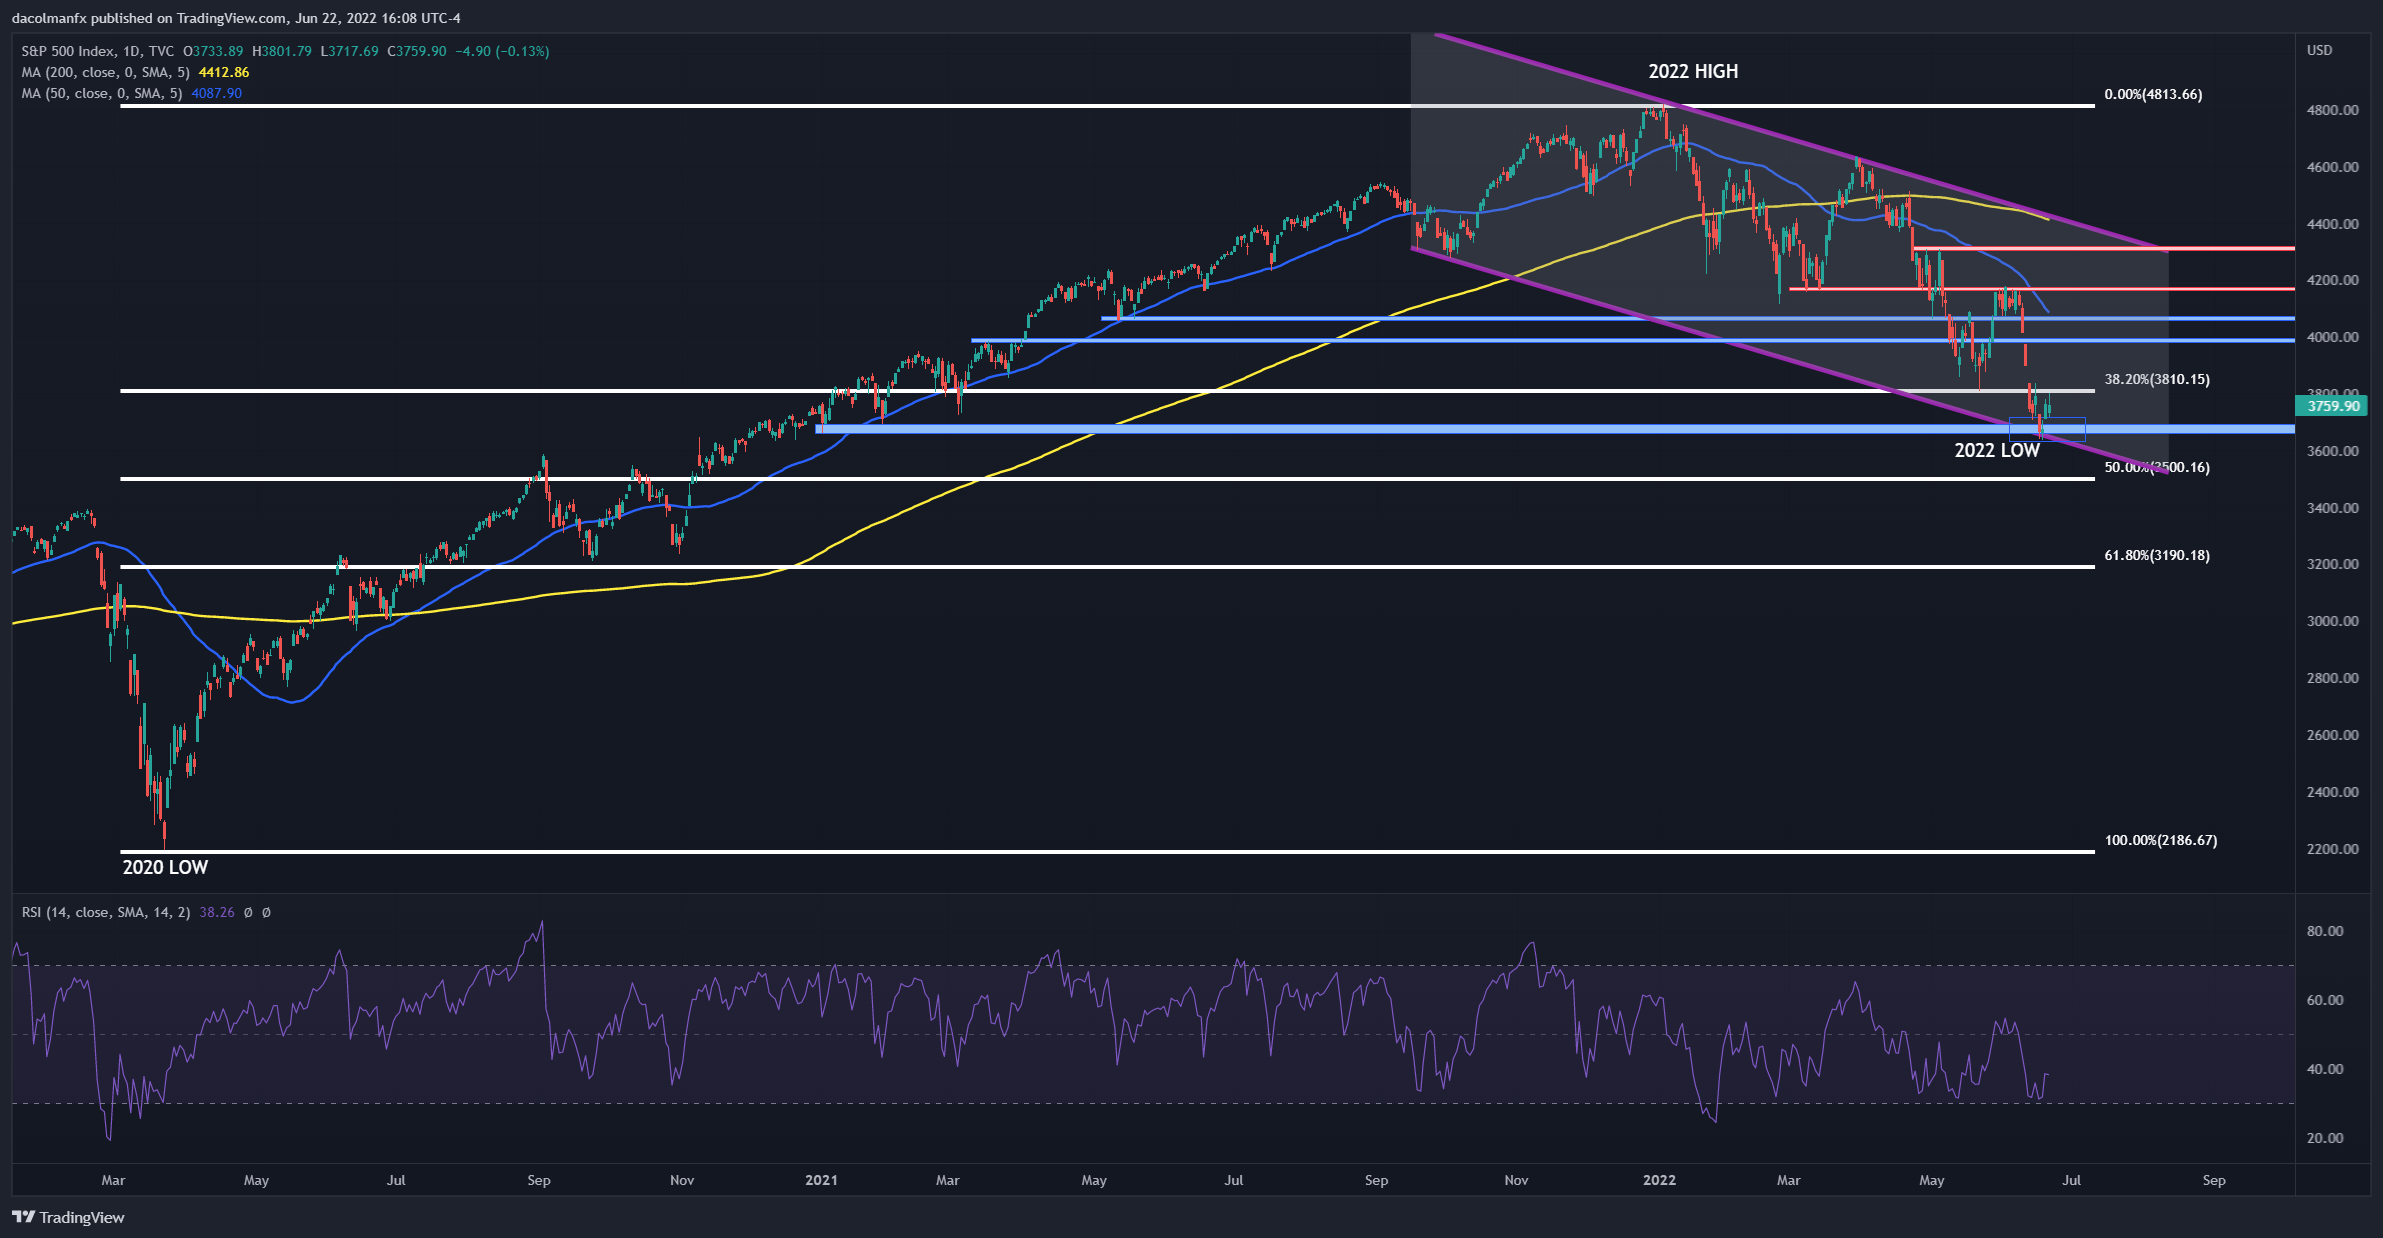
S&P 500 Daily Chart Prepared Using TradingView
EDUCATION TOOLS FOR TRADERS
- Are you just getting started? Download the beginners’ guide for FX traders
- Would you like to know more about your trading personality? Take the DailyFX quiz and find out
- IG's client positioning data provides valuable information on market sentiment. Get your free guide on how to use this powerful trading indicator here.
---Written by Diego Colman, Market Strategist for DailyFX


