Three-Dimensional Dispersion of Neutral “Plastic” Particles in a Global Ocean Model
 Thierry Huck
 Raphaël Bajon
 Nicolas Grima
 Esther Portela1,2
  Jean-Marc Molines
 Thierry Penduff
- 1Laboratoire d’Océanographie Physique et Spatiale (LOPS, UMR 6523), CNRS, Ifremer, IRD, IUEM, Univ Brest, Plouzané, France
- 2Institute for Marine and Antarctic Studies, University of Tasmania, Hobart, TAS, Australia
- 3CNRS, IRD, Grenoble-INP, Institut des Géosciences de l’Environnement (IGE), Université Grenoble Alpes, Grenoble, France
The fate of plastics entering the 3D ocean circulation from rivers discharge is examined through the Lagrangian analysis of neutrally buoyant particles. Particles are released continuously over 1991–2010 at the surface along the coasts according to monthly estimates of rivers plastic waste input. They are advected by daily currents from a state-of-the-art global ocean model at 1/12° resolution. At the end of the simulation (year 2010), particles remaining in the surface layer of 1 m thickness represent less than 2% of the total particles released. These are concentrated in the center of subtropical gyres, mostly in the South Indian Ocean, and the North Pacific, in relation with the large sources from Asia, and in good agreement with previous 2D numerical experiments in the surface layer. These patterns remain similar down to about 30 m depth, this upper layer strongly influenced by Ekman currents trapping about 20% of the total released particles. About 50% of the total released particles remain in the upper 100 m, and up to 90% are found in the upper 400 m at the end of the experiment. Below the mixed layer, they are more widely dispersed horizontally and follow the main global pathways of ocean ventilation of mode and deep water masses. Plastic particles, neutrally buoyant because of their small size or biofouling, are thus expected to be strongly dispersed in the global ocean thermocline following mode waters patterns, and reach the deeper layers following the North Atlantic Deep Water formation path. Two major source regions have a global impact. Particles from the western North Pacific spread over the whole Pacific Ocean poleward of 20°S, whereas particles from Indonesia spread over the whole latitude band from 60°S to 20°S.
1 Introduction
Plastic pollution of the environment is receiving growing attention as production increases at an exponential rate (Geyer et al., 2017) and its harmful influence on living organisms is better documented (Wright et al., 2013). Of the approximately 360 million tons of plastics produced each year (Plastics Europe, 2019), the exact fraction that reaches the ocean is difficult to assess. Land-based sources are considered the dominant input of plastic (GESAMP, 2015). For instance, Jambeck et al. (2015) estimated that 4.8–12.7 million tons of plastics entered the ocean in 2010 based on coastal population, waste production and mismanagement, whereas Borrelle et al. (2020) estimated 18–23 million tons entered aquatic ecosystems in 2016. The contribution of inland population through river systems is relatively lower, in the range 0.4–4 million tons (Lebreton et al., 2017; Schmidt et al., 2017). Yet, the total amount of plastics at the ocean surface is estimated to be only a small fraction of the released plastic–between 14 and 270 thousand tons—(Cózar et al., 2014; Eriksen et al., 2014; van Sebille et al., 2015), a paradox referred to as the “missing plastic problem”. Half of the plastic produced is not buoyant (Geyer et al., 2017) and accumulates in coastal and deep-sea sediments (Woodall et al., 2014). The floating half is subject to a large range of ocean surface processes that induce some vertical redistribution (van Sebille et al., 2020). Several studies also suggest that floating plastics are simply washed ashore and accumulate in coastal waters and on the shoreline (Lebreton et al., 2019; Chassignet et al., 2021; Onink et al., 2021). The most recent observations at depth report of a larger fraction of small microplastics down to several hundred meters depth (Pabortsava and Lampitt, 2020; Vega-Moreno et al., 2021; Zhao et al., 2022), even in the Arctic Ocean (Tekman et al., 2020; Ross et al., 2021). Egger et al. (2020) trace these deep plastics to the fallout from the surface convergence zones in the North Pacific Garbage Patch.
Most Lagrangian studies of plastic particles have been conducted in two dimensions at the ocean surface (Lebreton et al., 2012; Maximenko et al., 2012; van Sebille et al., 2012; Maes et al., 2018; Dobler et al., 2019; Chenillat et al., 2021), considering the floating fraction of plastics with density lower than seawater. Due to converging wind-driven Ekman currents in the surface layers, plastics accumulate towards the center of subtropical gyres (Kubota, 1994; Martinez et al., 2009; Onink et al., 2019). However, plastics are also subject to surface-intensified vertical turbulence (Kukulka et al., 2012; Reisser et al., 2015) that exports them to deeper layers where Ekman currents—hence convergence—are weaker. Wichmann et al. (2019) analysed the trajectories of particles at different levels, from the surface to 120 m, and found less convergence at deeper levels, in agreement with this theory. Nevertheless, they did not consider the vertical velocities that continuously induce transfers between vertical layers, downward and upward. In fact, very few Lagrangian studies have been performed in the three-dimensional ocean (Jalón-Rojas et al., 2019; van Gennip et al., 2019; Lobelle et al., 2021), the latter addressing head first the influence of biofouling on plastics density and their vertical displacement. Here we propose a more basic first level approach of neutrally buoyant particles advected in a 3D ocean model. This is an intermediate step that has been lacking so far in the hierarchy of simplified representations, and that helps to build up a better understanding of the processes driving plastics distribution in the global ocean.
The fate of plastic particles at sea is extremely complex, mostly because of several weathering processes like chemical degradation due to UV exposure, mechanical weathering, and fragmentation, but also of biological processes like biofouling (van Sebille et al., 2020). Because these processes modify the size, shape, number, and buoyancy of the plastic particles, following their behaviour in a Lagrangian framework is particularly challenging (Lobelle et al., 2021). However, this is not necessarily simpler in the Eulerian framework, where most studies classify plastics by their buoyancy instead of by their size, as for instance Mountford and Morales Maqueda (2019). So far, most Lagrangian studies have focused on the floating plastics—the tip of the iceberg–, for which a global observational dataset is becoming available (Cózar et al., 2014) and allows some validation. However, the behavior of very small microplastics, and even more the nanoplastics, is much less affected by buoyancy because of their large surface/volume ratio (Poulain et al., 2019). Other types of plastic debris like fibers, that are extremely abundant in waste waters, also behave as neutral particles in the ocean, and are advected by the three dimensional currents (Gago et al., 2018). Finally, the extreme complexity of biological processes that affect microplastics (Kooi et al., 2017; Lobelle et al., 2021) suggests to consider a simplified approach as a first order approximation. Therefore, the main question investigated in the present study is: What is the fate of neutrally buoyant particles released according to major plastics sources in the global ocean?
To address this question, we will use a Lagrangian approach to follow the trajectories of a very large number of particles using the daily three-dimensional currents from a state-of-the-art global ocean model at 1/12° horizontal resolution over the period 1991–2010. The particles will be considered neutrally buoyant and thus follow the water masses. Particles will be released continuously at the coast according to a seasonally-varying scenario of plastic emissions by rivers (Lebreton et al., 2017). There are of course large uncertainties in the quantification of the sources of plastics to the ocean from rivers and coastal population (Jambeck et al., 2015; Lebreton et al., 2018; Meijer et al., 2021; Weiss et al., 2021), especially for the smaller classes of plastics like small microplastics and nanoplastics. Given that these estimations are the basis of our study, one needs to be realistic and consider our results as a first attempt at investigating the 3D dispersion of neutral plastics, looking at the results as qualitative rather than quantitative. Plastics are a transient tracer in the ocean, they started to be produced and released in the ocean in the 1950s and the amount of production—and probably release in the environment—is doubling approximately every 20 years (Geyer et al., 2017). Given the time scales of ocean ventilation and water masses formation (hundreds of years), the amount of plastic found in the ocean is not in steady state, but increasing with time, just like in our model experiment.
The paper is organized as follows. Section 2 describes the numerical Lagrangian experiments. Section 3 presents the results in terms of initial dispersion, horizontal, and vertical final distribution of particles, before looking at their age and origin. Conclusions and their discussion follow in Section 4.
2 Materials and Methods
2.1 The Ariane Lagrangian Analysis Software
The Ariane software (Blanke and Raynaud, 1997) allows the exact calculation of 3D trajectories of numerical particles in stationary and non-divergent transport fields, defined on a C-grid (Arakawa and Lamb, 1977). The starting positions, in space and time, of the particles are defined by the user. Then the application sequentially reads the current fields of a global ocean circulation model to advect the particles and thus it computes their trajectories.
The Ariane application takes advantage of the properties of the currents discretization on a C-grid to analytically compute the particle trajectories. Between two updates of the velocity field (here at daily frequency), velocities are assumed to be stationary, such that the algorithm computes the actual trajectories through the exact calculation of the three-dimensional streamlines. Under this assumption of stationarity, these streamlines represent indeed the trajectories of the particles advected by the given velocity field (Blanke and Raynaud, 1997). Considering therefore the exact conservation of mass and that the transport at the land/sea interface is equal to zero, it is impossible for the particle to reach a land mesh or to be trapped at the coast.
In this study, particles are released continuously in time, following the monthly river plastic inputs (Lebreton et al., 2017) as detailed later, over a 20-years period (1991–2010). These decades were chosen to allow sufficient time for the numerical ocean model spin up (integration started in 1979), and to obtain final particle concentrations in a period where several observations were made, but statistically, we expect the results of a 20-years long experiment to be reasonably independent of the time period chosen. The particles have no dimension and are passively transported with the water mass. Their initial position is at the surface, in the middle of the first level of the model, i.e., at a depth of 0.5 m, in oceanic coastal grid cells of the model the closest to the river input positions. The number of particles per mesh is proportional to the river plastic input and the horizontal positions of the particles are randomly chosen within the grid cell, so that the particle trajectories are never exactly the same. Particles positions are recorded every month from their release date to the end of the simulation (31 December 2010).
Unlike the 2D experiments conducted in previous studies (Maes et al., 2018; Dobler et al., 2019; Chenillat et al., 2021), we use here the full 3D currents to advect the numerical particles. With the Ariane application and its trajectory computation algorithm, when we restrict the particle trajectories to two dimensions, the non-divergence of the transports in a mesh is no longer respected and particles at the coast can run aground. On the other hand, here, when we use currents in three dimensions and because of the property of mass conservation enforced by the model, the particles never run aground. This configuration of the model would thus not be appropriate to estimate the amount of beaching for instance (van der Mheen et al., 2019; Onink et al., 2021). For floating particles, the fraction of released particles blocked at or near the coast is estimated between 36 and 77% (Chassignet et al., 2021; Chenillat et al., 2021; Onink et al., 2021), but this fraction is unknown for neutral particles.
2.2 The NEMO ORCA 1/12° Global Ocean Simulation
Particles are advected over the period 1991–2010 by daily-averaged three-dimensional velocities obtained from a 1/12° global ocean/sea-ice/iceberg 1979–2019 simulation referred to as eORCA12.L75-GJM2020. This simulation is based on the Nucleus for European Modeling of the Ocean (NEMO version 4.0.2, Madec, 2012) model, and was performed by the DRAKKAR group. Its grid spacing varies from 9.2 km at the equator to 2.5 km at high latitudes with 75 geopotential levels (1 m vertical resolution near the surface increasing up to 200 m in the deep ocean) and a partial step representation of topography. Compared to the ORCA12 NEMO configuration used for instance by Mercator Ocean International for ocean circulation reanalyses (GLORYS12, e.g., Artana et al., 2021), the eORCA12 configuration used in the present study is extended toward Antarctica. This southward extension allows a better representation of the iceshelf front location off the coast of Antarctica; freshwater fluxes from ice shelf melting (Mathiot et al., 2017) and iceberg calving (Marsh et al., 2015) into the ocean are prescribed along this front.
The NEMO eORCA12 simulation is started from rest on 1 January 1979 from temperature and salinity fields derived from the ENACT-ENSEMBLE EN4 climatological fields (Good et al., 2013), and is forced by the JRA55-do 1.4.0 atmospheric reanalysis (Tsujino et al., 2018). The model uses an energy and enstrophy conserving momentum advection scheme (Barnier et al., 2006; Penduff et al., 2007; Le Sommer et al., 2009). For the tracers, the model uses a total variance diminishing (TVD) advection scheme and an isopycnal Laplacian diffusion operator. The vertical mixing scheme is based on the TKE turbulent closure model (Blanke and Delecluse, 1993) with a convective adjustment scheme based on enhanced vertical mixing in case of static instability.
The vertical velocities of the model are critical for the vertical spreading of the particles. These are rarely examined in z-coordinate ocean models, where they are computed through the mass-conservation (continuity) equation as a by-product of the integration of the horizontal momentum equations. They are often considered to be noisy because of the bathymetric steps, and depending on advection and viscosity parameterizations (Le Sommer et al., 2009). In addition, their amplitude varies considerably with the horizontal and vertical model resolution, and their time averaging. We have chosen to use this global model simulation precisely because of the availability of daily outputs over 40 decades. We have carefully examined the vertical velocity fields and computed typical magnitudes from
2.3 Continuous Input From Rivers
The release scenario is based on the amount of plastic entering the ocean from rivers estimated by Lebreton et al. (2017) from population density, rates of mismanaged plastic waste production by country, and monthly catchment runoff. Monthly quantities (in tons) are provided for 40,760 catchments input points. We use their “midpoint estimate” that amounts to about 2 million tons of plastic waste entering the ocean every year. The 20 top polluting rivers are mostly located in Asia and account for 67% of the global total (Figure 1A). Due to the seasonal catchment runoff, there are very large seasonal variations in these inputs, the total amount for August being almost 5 times that of January for instance (Lebreton et al., 2017). These variations were important to take into account in conjunction with the large seasonal cycle of ocean currents, such as the monsoon in the Indian Ocean that severely affects plastic pollution (van der Mheen et al., 2019; Pattiaratchi et al., 2022). These data were downloaded from the global model inputs for monthly midpoint estimates (Lebreton and Reisser, 2018). A first step was to convert the mass input into a number of particles, such that a total of about 10 million particles were released annually (all particles represent the same amount of plastic). The rounding to an integer number of particles released each month at source points reduces the number of effective sources to 5,676 (compared to 40,760), still representing 99.9% of the total input. Particles were released at the nearest ORCA 1/12° coastal ocean grid cell of each catchment, based on its latitude and longitude provided in the input data. Their initial positions were determined randomly within the coastal ocean grid cell, such that each trajectory is unique.
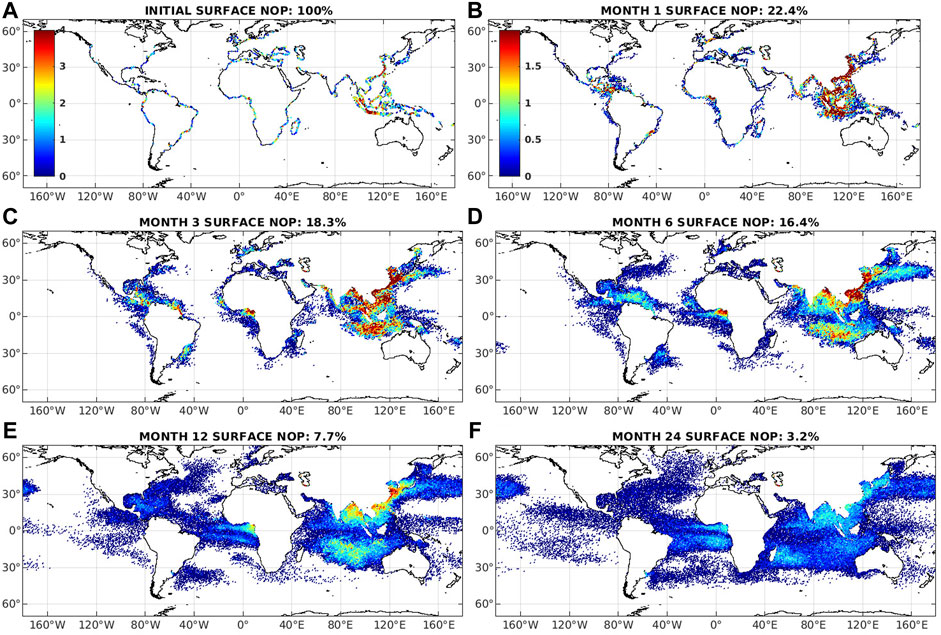
FIGURE 1. Initial dispersion of particles released according to the river input over the first years of simulation (averaged over the 12 monthly releases). (A) Total number of released particles on the NEMO ORCA 1/12° grid according to (Lebreton et al., 2017). (B–F) Number of particles in the surface grid cells 1, 3, 6, 12, and 24 months after their release, showing the horizontal dispersion. A logarithmic scale (log10) is used for the colorbars, and the colormap for panels BCDEF is the same and shown in panel (B). The number in the figure title is the fraction of particles in the surface layer at the time after release. Only 22% of the particles remain at the surface after the first month of 3D advection because of vertical spreading. NOP stands for Number of Particles. The difference with the next figures is that here, only particles of the same age (N month) are shown, and not all the particles that have been released between initialisation and the month indicated in the title.
Particles were released continuously at the beginning of every month over the duration of the simulation, from 1 January 1991 to the end of 2010 (20 years). The maximum of the global river discharge is in August and accounts for 1,619,932 particles in our simulation, 5 times the minimum of the rivers emission occurring in January (327,014 particles). The number of particles released amounts to 9,994,234 every year, and reaches almost 200 million particles in total at the end of the 20-years simulation. Particle positions were recorded at a monthly frequency.
3 Results
3.1 Initial Horizontal Spreading and Vertical Dispersion
The amount and location of particles released annually at river mouths is shown in Figure 1A. About 10 million particles are released annually in our simulation, the largest fraction being located in South-East Asia—details of the source distribution are fully discussed in Lebreton et al. (2017). After their release, particles follow the surface currents and spread neutrally from the source regions. The number of these released particles remaining at the surface after 1, 3, 6, 12, and 24 months is shown in Figure 1. These numbers are averaged over particles released over the first 12 months of the simulation to filter out the seasonal cycle, such that the patterns represent mostly the spread and the influence of the annual-mean surface currents, but not the instantaneous direction of surface currents. Each panel title indicates the total number of particles at the surface relative to the total number of particles released in a year. During the initial months, the Asian region exhibits the largest plastic concentrations in the surface, slowly spreading from the major source regions, in the China Sea and around Indonesia first, towards the Bay of Bengal and towards Australia, and by month 3 and 6 spreading eastward through the Kuroshio western boundary current and its extension (Figure 1). Surprisingly, although the Indonesian coastline has one of the largest inputs, there are no more of these particles at the surface around Indonesia after 6 months, they have been advected southward in the South Indian basin and spread vertically in the mixed layer. In the Atlantic Ocean, the major sources are in the Gulf of Guinea and around the Amazon, the former spreading offshore and along the coast in both directions, whereas the latter spreads north-westward towards the Gulf of Mexico following the Brazil current. The particles from the western North Atlantic coast are found in the Gulf Stream after 3 months, in the North Atlantic Current after 6 months, and in the subpolar gyre within 1 year.
At the time of their release, all particles are in the surface layer, but after a single month of advection, about 78% of these particles have left the surface. This surface depletion does not continue at the same rate afterwards, once particle concentrations is homogenized in the first layers—after 6 months at sea, “only” 84% of the particles are missing from the surface. Within a single month, because of the strong vertical velocities in the upper ocean layers associated mostly with downward Ekman velocities, particles are distributed over the upper 10 m (not shown). This very fast sinking process is followed by a much slower process exporting the particles to deeper regions, either through ventilation or deep water formation.
3.2 Final Horizontal Distribution
About 200 million neutral particles were advected by the oceanic currents over the course of the 20-years long simulation with continuous input from river emissions. We now analyze the number of particles averaged over the last year of the simulation, 2010, in order to filter out the seasonal variations due to both the monthly variations of the input, and the seasonal cycle of the ocean currents. When looking at this final distribution of particles, one must keep in mind that it consists of the sum of the particles of all ages, from the ones released in 1991 (19 years “old”) and having travelled long distances, to the ones released less than a year ago and still close to their initial release location. The concentration of particles (number of particles divided by the layer thickness, rather than the simple count since the model levels thickness increases with depth) is shown for characteristic depths down the water column: surface, 20, 200, 600, and 2,000 m (Figure 2). The patterns show very striking features, both on the horizontal and on the vertical, that point to the different driving dynamical processes: wind-driven Ekman convergence in the surface layers, ventilation in the thermocline (mode waters), intermediate and deep water formation at deeper levels.
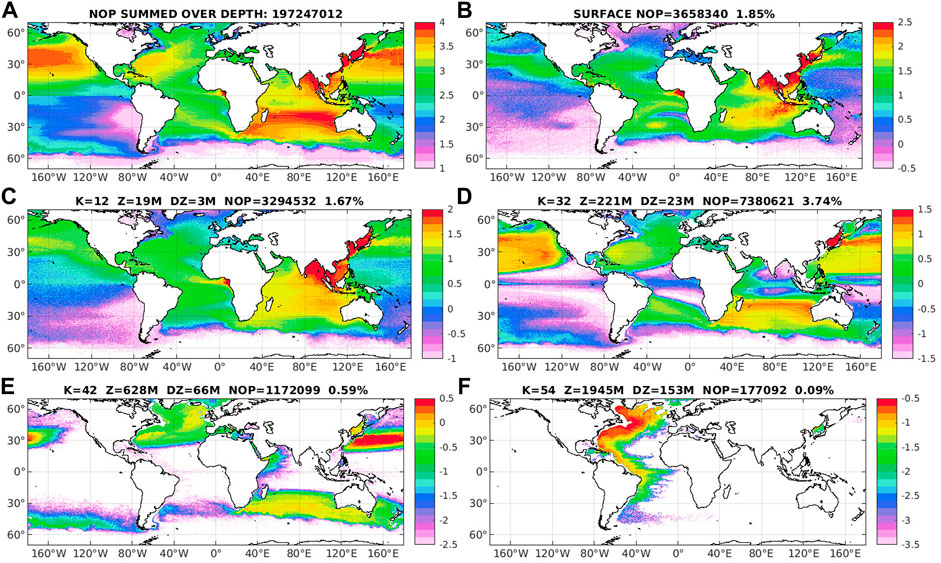
FIGURE 2. Horizontal distribution of particles at different depths at the end of the 20-years long simulation, averaged over the last year (12 monthly outputs). (A) Horizontal distribution of particles summed over depth (in number of particles per 1/2°×1/2° grid cell). Number of particles per grid cell divided by the layer thickness (in #/m) (B) at the surface, (C) at 20 m depth, (D) at 220 m depth, (E) at 630 m depth, and (F) at 2,000 m depth. The number of particles is computed on a regular 1/2°×1/2° to filter out the noise on the native irregular NEMO ORCA 1/12° grid. Note the logarithmic scale covering 3 orders of magnitude to enhance lower concentration regions, and the colorscale varying with depth, as the concentration in particles/m decreases monotonically with depth. Every other color range, the particle concentration doubles. Panel titles indicate the vertical level index K, the mean depth Z, the layer thickness DZ, the total number of particle in the layer NOP and the fraction of the total particles it represents. Level 32 at 221 m, with a 22.5 m thickness, contains the largest number of particles (3.7%) and shows the strongest horizontal dispersion.
The number of particles integrated over depth (Figure 2A)—90% of them in the upper 400 m (next subsection)—strongly differs between the ocean basins. The peak amounts are at the largest emission river mouths (South-East/East Asia, from the Bay of Bengal, the South China Sea, the Yellow Sea, and East China Sea), and immediately downstream (the Sea of Japan for instance). These Asian sources clearly spread eastward all across the North Pacific basin through the Kuroshio and its extension. Downstream of the major Asian sources regions that show the highest amount of particles, the South Indian basin shows a very large area with the second highest amount of particles, and the North Pacific basin shows the third largest amount. The connection of the main source region with the convergence zone in the South Indian basin is not as clear (Figure 2A). Particles from continental Asia and Indonesia sources accumulate and end up in the subtropical gyre all across the Indian basin from Madagascar to Australia, as explained by van der Mheen et al. (2020). This convergence zone leaks toward the South Atlantic basin through the Agulhas Current. With vertically-integrated amounts at least twice smaller than the top three regions just discussed, the North Atlantic subropical gyre shows more homogeneous amounts of particles, with the largest values in the west of the basin, associated with the Gulf Stream and its southern recirculation, the North Atlantic Current, and the Azores current branches. Overall, this picture shows a very large dispersion of particles in the global ocean, with particles present throughout the globe except in the Antarctic Circumpolar Current (ACC) and southward, as well as in the eastern South Pacific. The ACC remains a strong dynamical barrier against plastic pollution spread, unless storm-driven Stokes drift events are taken into account (Fraser et al., 2018).
At the end of the 20-years long simulation, only 1.85% of the total released particles (3,658,340) are found at the sea surface (Figure 2B)—note the surface level thickness is 1 m such that the number of particles is the same as its concentration in number of particles per m of depth. The South Pacific and the Antarctic Current region show almost no particles at the surface, mostly because of the absence of sources within the basin of attraction of these regions. In contrast, the highest concentrations are found along the Asian rim, from the Bay of Bengal to the South China Sea and up to the Sea of Japan, in the South Indian Basin, and in the Gulf of Guinea, i.e., associated with the major river inputs. The influence of surface currents in the spread of the sources is obvious in several regions. The Kuroshio and its extension transport the large coastal concentrations along the western boundary towards the central and eastern North Pacific, as nicely illustrated by Lebreton and Borrero (2013) for tsunami debris. The Agulhas Current at the southern tip of Africa exports the large concentrations of the South Indian basin towards the South Atlantic subtropical gyre, a scenario that is evident here without the help of wave-induced Stokes drift (Dobler et al., 2019). The equatorial current first and then the Brazil current transport the large inputs of the Gulf of Guinea across the Atlantic towards the Gulf of Mexico and further along the Gulf Stream and North Atlantic drift. These patterns remain more or less the same over the upper 30 m (as illustrated at 20 m in Figure 2C), where the plastic distribution is determined by the main source regions.
At around 200 m (Figure 2D) and 600 m (Figure 2E) depth, the patterns are strikingly different from the upper layers (a correlation analysis of the final number of particles on a 1/2° regular grid between different levels shows correlations lower than 0.3 between level 32 at 220 m and the 8 levels above 10 m, and lower than 0.07 for level 42 at 630 m) with more widely extended areas of large concentrations in subtropical and subpolar regions. These distribution patterns are clearly associated with the main regions of ventilation and mode water formation (for example, Talley, 1999; Hanawa and Talley, 2001), with an intensity modulated by the particle input in the attraction basin of each mode water. For instance, around 200 m depth (Figure 2D), the plastic distribution largely follows the patterns of subduction of SubAntarctic Mode Waters in the southern Indian Ocean. Important plastic concentration is also found in the subtropical gyres of the North Pacific Ocean and to a lesser extent of the North Atlantic basin, where Subtropical Mode Waters (STMW) are formed by subduction (Portela et al., 2020). The relatively higher concentration of plastics in the Pacific basin than in the Atlantic basin must be related to the location of the main sources. The lowest particles concentration are found in the weakest ventilated regions of the global ocean, i.e., those associated with the oxygen minimum zones in the Eastern boundaries of all ocean basins and in the northern Indian Ocean. At 600 m depth no plastic is found in the tropical band (Figure 2E) and the highest concentrations seem to be associated with the deepest limit of the mode waters and with the spread of Intermediate waters (which spread from the Southern Ocean and reach a mean depth of 1,000 m northward).
The North Pacific is the largest reservoir of neutral plastic particles, with a wider spatial distribution at 200 m over the whole basin and a more focused concentration at 600 m following the contours of the Subtropical Mode Waters (STMWs). Note that about 30% of the particles are found in the 200–700 m depth range at the end of the simulation, such that these layers weight heavily in the water-column-integrated number of particle discussed previously. In the South Indian Ocean, the patterns follow more or less the upper layers, but shift 10° poleward at 600 m, where they follow the contours of STMWs and Subantarctic Mode Water. In the North Atlantic ocean, large concentrations are found all over the basin, following the contours of subtropical and subpolar mode waters, the concentrations shifting about 10° northward at 600 m compared to 200 m. The concentration of the neutral “plastic” particles in the thermocline waters below the mixed layer are manifestly tied to the intrinsic ocean dynamics of the basins. Particle transport from the surface to depth has been studied previously with Lagrangian analysis in relation with water masses formation, subduction, ventilation, and circulation (for example, Blanke et al., 2001). For instance, the high concentrations found in the western Pacific between 30°N and 40°N are associated with the recirculation of intermediate waters illustrated by Speich et al. (2007) their Figure 1. The key qualitative difference between the final concentrations at 200 and 600 m is the quasi-absence of particles in the tropics, such that the distribution of the particles is much more localized at depth, and more dispersed at 200 m.
At 2,000 m depth (Figure 2F), the distribution pattern highlights the North Atlantic Deep Water (NADW) formation and southward spreading along the deep western boundary current, in a way similar to man-made Tritium and Chloro-fluorocarbon (Rhein et al., 2002; Rhein et al., 2015, for instance). Within 20 years, the NADW tongue entraining neutral particles from the European and North American rivers has almost reached the Zapiola seamount region in the Argentina basin, at the northern edge of the Antarctic Circumpolar Current. Interesting smaller scale features show zonal spreading eastward at the equator and other latitudes, in the form of zonal jets. This large-scale distribution pattern extends very clearly from about 1,400 m to 3,000 m depth, i.e., the depth range of the different classes of NADW. Such NADW pathway is well documented in previous Lagrangian analyses of the Atlantic Meridional Overturning Circulation, oceanic ventilation, and water masses formation (Blanke et al., 2001; Blanke et al., 2002a; Blanke et al., 2002b).
3.3 Vertical Distribution
Averaged over the global ocean, the concentration of particles is monotonically decreasing with depth (Figure 3A). It decreases regularly over the thermocline, down to about 800 m, by about three orders of magnitude, and then shows a plateau over the depth range of the North Atlantic Deep Water. Consequently, the final vertical distribution of particles (Figure 3B) shows that most of the neutrally buoyant particles either remain in the upper layers of the ocean, with about 90% of the particles above 400 m depth, or it takes longer for them to be transported to deeper layers. In the surface mixed layer, about 10% of the particles are in the upper 10 m, 20% above 30 m, 30% above 50 m, and 50% above 114 m (Figure 3B).
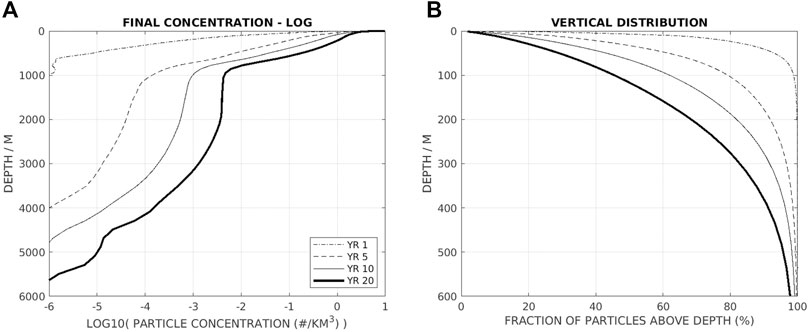
FIGURE 3. Vertical distribution of particles at different times of the 20-years long simulation. (A) Concentration of particles as a function of depth—concentration is defined as the number of particles at each vertical level divided by the total ocean volume of each layer (in #/km3). Note the log10 scale for the concentrations. (B) Number of particles integrated from the surface, represented as the percent of the total amount of particles released as a function of depth (zoomed over the thermocline).
The evolution of these vertical concentrations with time (Figure 3A) allows to track the particles on their way downward. By the end of the first year, particles have barely reached 600 m. By the end of the fifth year, they have reached down to 4,000 m, by year 10, down to about 4,800 m, and by year 20, down the whole water column. Between year 10 and 20, the shape of the vertical distribution has not fundamentally changed, but the whole distribution is shifted because of the doubling of the total number of particles. An interesting feature of these final vertical distributions is the clear shift in the slope of the concentration around 1,000 m depth, probably linked to the 2 modes of ventilation of mode waters and deep water formation, but its explanation will be left for future work.
A zonally-averaged meridional section of the particle concentrations (Figure 4) provides a synthesis of our results so far. In the upper 1,000 m, the dumbbell structure of the larger concentration region reproduces the characteristic bowl-shaped pattern of the oceanic thermocline (Huang, 2015), with vertical gradients intensified in the equatorial region, and the thickness of the high-concentration regions following the isopycnals deepening associated with the subtropical gyres. This points out to the thermocline, and especially the northern hemisphere one because of the location of the major plastic sources, as the largest reservoir of particles.
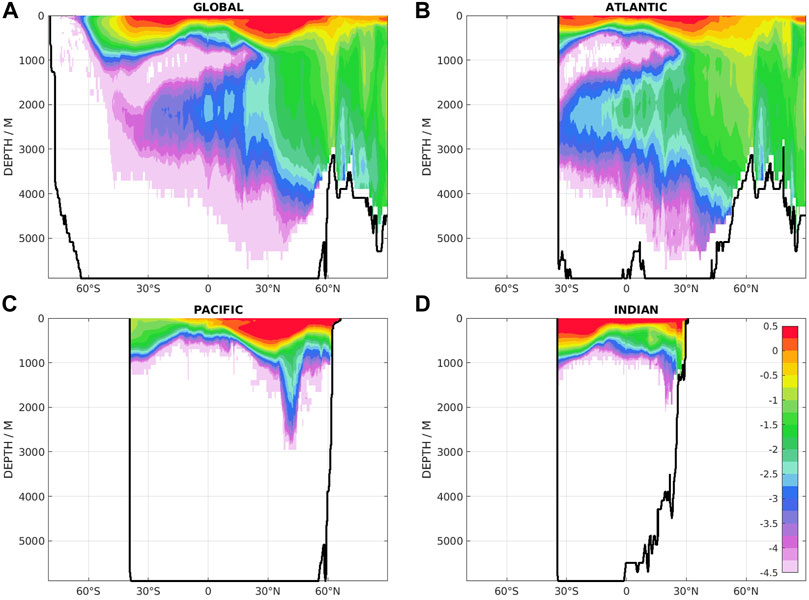
FIGURE 4. Concentration of particles (in #/km3) as a function of latitude and depth at the end of the 20-years long simulation, for (A) the global domain, (B) the Atlantic, (C) Pacific, and (D) Indian sectors. The number of particles is first integrated zonally over 1/2° latitude bands for each vertical level, divided by the ocean volume for the same latitude band and vertical level, and represented as a function of latitude and depth, in log10 scale of the concentration to highlight the lower concentrations along the North Atlantic Deep Water path around 2,000 m depth. The same color scale is used and shown in panel (D). The thick black line is the zero contour for the zonally integrated volume as a function of latitude and depth (below this depth, there is no ocean gridpoint at the given latitude).
Below 1,000 m, particles in the global zonally-averaged section (Figure 4A) mostly belong to the Atlantic basin (Figure 4B). In both panels, a region of minimum values is found around 1,000 m from Antarctica to about 25°N. Below, a thick tongue with higher concentrations (much lower than in the thermocline though) extends between 1,000 and 4,000 m depth, and connects to the North Atlantic north of 25°N, where large concentrations are found over the whole water column. This tongue shows decreasing concentrations and thickness from 25°N southward. It is the prominent signature of the Atlantic Meridional Overturning Circulation entraining neutral particles on its southward pathway along the western boundary (Figure 2F). North of about 60°N in the Atlantic, significant concentrations are found over the whole water column. These are probably associated with the northward transport of particles by the Gulf Current and subsequent sinking in the subpolar deep convection regions where NADW is formed. These waters with almost homogeneous concentrations of particle are found over the northern North Atlantic and all over the Arctic basin, in good agreement with recent observations (Ross et al., 2021).
3.4 Particles Age
So far, we have only looked at particles concentrations, regardless of the particles age. To investigate more accurately the history of particles, we define the “age” of particles at the end of the simulation as the difference between the final date (31 December 2010) and their release date, so this age is an integer number of months and cannot exceed 20 years. Then we can compute the mean age of the particles in each model grid cell by averaging the age of all particles present at the final time. The mean age of the particles at different depths at the end of the simulation is shown in Figure 5. It provides a globally coherent information with respect to the expected pathways of the particles. Particles are generally “young” at the surface close to the large source regions of Asia (Figures 5B, C), and much older deeper in the water column (Figures 5E, F) except for the strongly ventilated regions (mostly the North Pacific, North Atlantic and South Indian at 220 m, Figure 5D).
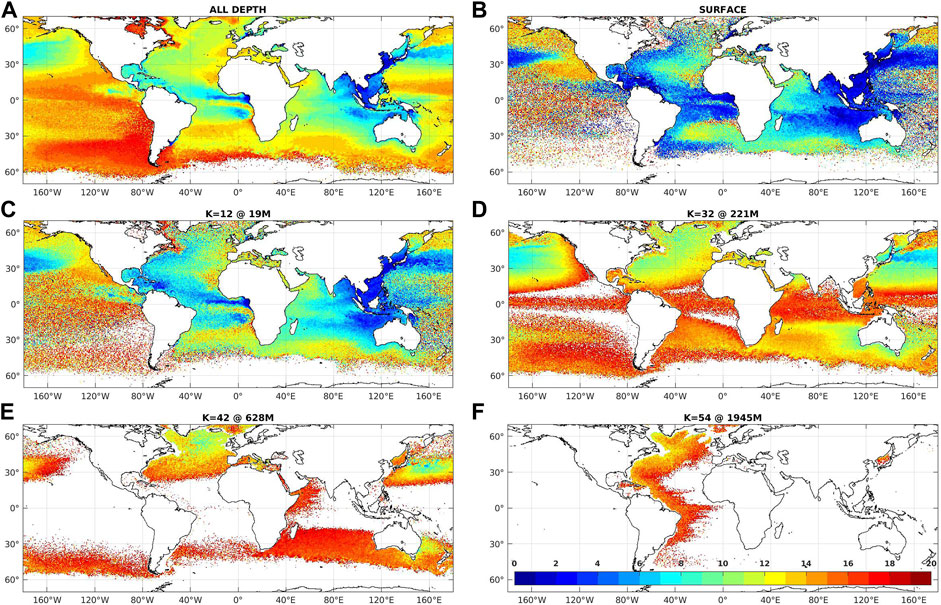
FIGURE 5. Mean age of the particles at different depth at the end of the 20-years long simulation (in year), computed on a regular 1/2°×1/2° grid. (A) For all particles summed over depth. (B) For particles at the surface, (C) at 20 m depth, (D) at 220 m depth, (E) at 630 m depth, and (F) at 2,000 m depth. The same color scale is used and shown at the bottom of the lower right panel (F).
The globally-averaged particle age as a function of depth (not shown) is almost monotonically increasing below a well-mixed upper layer, from 3.5 years at the surface and 4.4 years at 10 m, to 6.7 years at 20 m, 11.8 years at 220 m, 13.7 years at 600 m, and 14.4 years at 2,000 m, and 17.0 years at 5,700 m. From the surface to about 20 m, particles younger than 5 years are found close to the large sources regions (South-East Asia, Indonesia, Gulf of Guinea) and downstream through the subpolar gyres anticyclonic circulation (Figures 5B, C), whereas older particles are found in regions with very low sources (mostly the South Pacific basin, and the south-eastern North Pacific). Between 200 and 600 m (Figures 5D, E), particles are generally older than 15 years, except for the ventilated regions of the North Pacific, North Atlantic, and South Indian, associated with mode water formation. There is a striking contrast between young particles above 20 m and older particles below 200 m in the tropical and equatorial Atlantic and Indian basins, revealing the very shallow and sharp thermocline separating mixed layer “local” waters from particles advected from remote regions (as we shall see also from the origin of the particles in Figure 6). At 2,000 m (Figure 5F), there is a clear age gradient from North to South along the North Atlantic Deep Water pathway (from 10 years in the Greenland and Labrador Seas to 17 years offshore Argentina), but also eastward from the western boundary current.
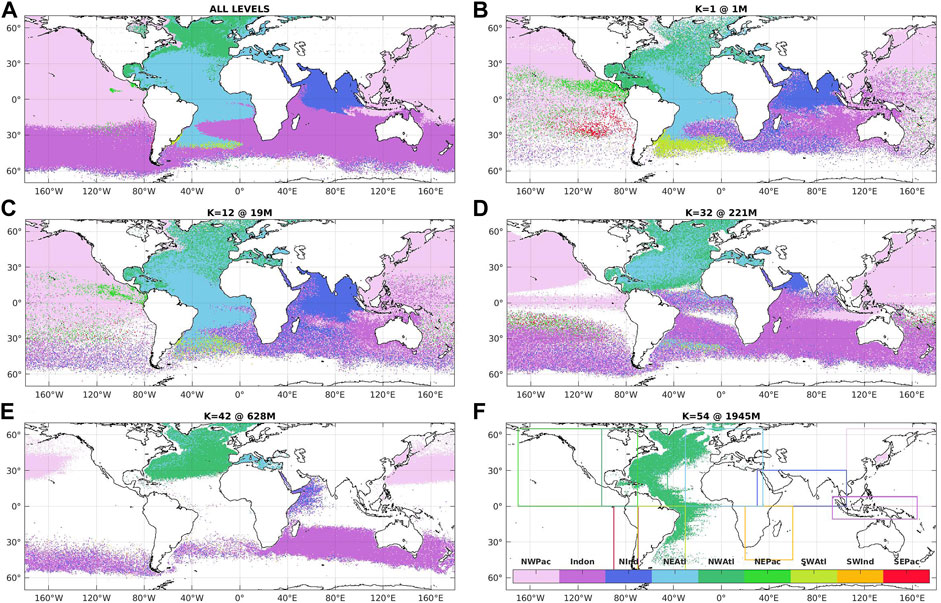
FIGURE 6. Region of origin of the particles at the end of the 20-years long simulation, computed on a regular 1/2°×1/2° grid. (A) For all particles over the water column. (B) For particles at the surface, (C) at 20 m depth, (D) at 220 m depth, (E) at 630 m depth, and (F) at 2,000 m depth. The color indicates the region from which the largest number of particles originates. The same color code is used and shown at the bottom of the lower right panel, with the regions defined according to the geographical boundaries drawn and the basin masks provided with NEMO ORCA 1/12° configuration; Indonesia mask overrides other regions; gridcells belong to a single region (no overlap). The regions are ordered according to the total amount of particles released, the western North Pacific (53.5%), Indonesia (17.2%), the North Indian Basin (13.8%), the eastern North Atlantic including the Mediterranean Sea and the Gulf of Guinea (7.6%), the western North Atlantic (4.6%), the eastern North Pacific (0.6%), the western South Atlantic (0.4%), the western South Indian (0.1%), the eastern South Pacific, and eastern South Atlantic (0.04%)—sources from Australia are too weak to be represented in our release scenario.
3.5 Particles Origin
Finally, we investigate the geographical origin of the particles at the end of the 20-years simulation. For this purpose we have distinguished several regions based on somewhat arbitrary boundaries (Figure 6F), distinguishing west coasts and east coasts for each hemisphere ocean basin, and isolating Indonesia because of its relatively large input (Jambeck et al., 2015) and its position across the Equator. Then we have computed for each grid cell, at the end of the simulation, the number of particles originating from each region. The grid cell is then flagged with the region of origin of the largest number of particles (whatever the fraction of the total particles it represents). In general, particles in an ocean basin at the end of the simulation originate in the same basin. This is particularly true at the surface, and for the North Indian, Pacific, and Atlantic basins. The most striking exception is the very wide spreading of particles from Indonesia all over the Southern Hemisphere, most visible on Figure 6A for the whole water column and between 200 and 600 m (Figures 6D, E), highlighting the principal pathways from the Indian basin to the South Atlantic basin through the Agulhas Current, and to the South Pacific south of Australia.
More than half of the total released particles (53.5% exactly) originate from the western North Pacific, mostly from Chinese rivers. As described earlier, these particles are entrained by the North Pacific western boundary current, the Kuroshio, and its eastward extension, all across the North Pacific basin (Maximenko et al., 2018). Their vertical entrainment is also important, particularly in the subduction regions south of the Kuroshio, such that the spreading of these particles extends down to more than 600 m. These particles show the largest horizontal and vertical spreading.
The particles released from the numerous Indonesian rivers are second in source amount and final spreading (17.2% of the total), that mostly cover the southern hemisphere, especially at depth from 200 to 700 m. These particles mostly flow from the South Indian basin westward to the South Atlantic through the Agulhas current in the upper 250 m, but also eastward to the South Pacific from 200 to 700 m within the SubAntarctic Mode Water. The third source region in terms of released amount of particles is the North Indian basin, including the rivers from the Bay of Bengal and from India (13.8%). Particles ending in the upper 100 m in the North Indian basin mostly originate from this region, although some export is visible in the surface layers along the East African Coast and Madagascar towards the South Atlantic basin (mixed with particles from Indonesia).
In the Atlantic basin, sources from the Eastern North Atlantic (7.6%), including the Mediterranean Sea and the Gulf of Guinea, and the Western North Atlantic (4.6%) are of comparable magnitude but spread very differently. Particles found in the subtropical Atlantic largely originate from the Eastern region, mostly the large rivers input from the Gulf of Guinea, but their vertical spreading remains limited to the surface layers except in the North Atlantic subtropical gyre. Particles found in the subpolar gyre originate from both coasts, with a dominant contribution from the western sources, especially at depth below 300 m. At 2,000 m, particles following the North Atlantic Deep Water flow originate mainly from the western North Atlantic, supplying most of the North Atlantic subpolar gyre waters through the Gulf Stream and North Atlantic Drift, as highlighted at 600 m depth.
4 Discussion and Conclusion
We have investigated herein the fate of particles released continuously at the coast according to river plastic emissions, assuming their density is equal to the density of seawater (i.e., neutral buoyancy). About 200 million particles were released in total over a 20 years long simulation, at the monthly rate of 327,014–1,619,932 particles according to the seasonal cycle. The 5,676 effective release points (river mouths), i.e., emitting more than one particle per year, represented 99.9% of the total input estimated by Lebreton et al. (2017). The particles trajectories are computed according to daily currents of a state-of-the-art global ocean model at 1/12° resolution over the period 1991–2010 using the Lagrangian software Ariane. The 3D dispersion of these particles shows very non-isotropic features shaped by the ocean currents, in close connection with the processes of ocean ventilation and water masses formation. At the end of the simulation, less than 2% of the total released particles remained in the surface layer of 1 m thickness, about 50% are found in the upper 114 m, and up to 90% in the upper 400 m.
Because of the rapid transfer of particles to shallow lower levels (over about 10 m) within the first month after their release, the particle distribution at the surface down to 20 m reflects the large influence of the sources, with the largest concentrations in the Asian rim from the Bay of Bengal to the China Sea up to the Sea of Japan, but also in the Gulf of Guinea. In the subtropical gyres convergence zones, the largest concentrations by far are found in the South Indian Basin, with particles originating partly from Indonesia and Java and from mainland Asia. Second in rank are the South Atlantic Ocean and the North Pacific. When looking at the number of particles integrated over the whole water column, the North Pacific ranks second after the South Indian Basin, far exceeding the other basins, but the particles are mostly found at depth between 200 and 800 m. These particles originate from two major source regions that have a global impact. Particles from the western North Pacific spread over the whole Pacific Ocean poleward of 20°S, whereas particles from Indonesia spread over the whole latitude band from 60°S to 20°S.
Directly below the mixed layer, particles are no longer subject to the wind-driven Ekman currents responsible for the surface convergence in the center of subtropical gyres. Particle concentrations are thus lower but more widely spread than at the surface, with very large regions of almost homogeneous concentrations—this feature has already been noted by Wichmann et al. (2019) in 2D Lagrangian experiments performed at different levels down to 120 m. The most intense horizontal spreading occurs around 200 m depth where all subtropical gyres except the South Pacific show significant concentrations. Several dynamical processes contribute to this spreading: energetic western boundary currents and their recirculations, and mode water formation. Around 600 m, the largest concentrations are found in the North Pacific with maximum values in the western basin, following patterns of ocean ventilation and mode waters. Below 1,000 m, the prominent pattern is the Atlantic deep western boundary following the North Atlantic Deep Water path with maximum values around 2,000 m depth vertically, and in the Labrador Sea decreasing southward down to the Antarctic Circumpolar Current horizontally. The latitude-depth structure of particles concentration shows large concentrations in the bowl-shaped thermocline, decreasing with depth, except for the prominent signature of North Atlantic Deep Water.
An intriguing aspect of the results is the relatively low concentrations in the North Pacific subtropical gyre at the surface (aka the Great Pacific Garbage Patch in the media), compared to the Indian Ocean, the South Atlantic or even the North Atlantic. As already illustrated by Chenillat et al. (2021) their Figure 1, the amount of plastic that enters the North Pacific from the Asian coastline is much larger than any other region, but lower from the river input used here than from the coastal population mismanaged waste (Jambeck et al., 2015; van Sebille et al., 2015), leading to a lower feeding of the North Pacific subtropical gyre. Work is underway to reproduce these simulations with a coastal population mismanaged waste scenario and estimate its influence on the concentrations in the North Pacific convergence zone. In addition, the model 3D dynamics used here is such that these plastics rapidly disappear from the surface, and progressively feed deeper layers between 200 and 800 m. Another explanation may come from the influence of (wind-) wave-induced Stokes drift that is not taken into account in these simulations, but ongoing work—albeit with lower resolution models—seems to suggest Stokes drift has a significant influence on the retention of particles at the surface (Bajon et al., manuscript in preparation).
For the particles transport in the Lagrangian framework, we have only taken into account the influence of currents resolved by the ocean model, because of its limited spatial resolution in the horizontal and vertical, and its temporal resolution. There are several other processes that should be estimated to validate our results, the ones that come readily to mind being the vertical eddy diffusion due to energetic surface turbulence (Kukulka et al., 2012; Fischer et al., 2021; Onink et al., 2022), and tidally-driven mixing whose impact is not confined to the bottom but reaches the thermocline (Tuerena et al., 2019; Portela et al., 2020). These processes as well as submesoscale processes with large vertical velocities in the upper layer are not resolved within our NEMO simulation at 1/12° (Klein and Lapeyre, 2009). Investigating such processes requires even higher horizontal and vertical resolution, that are hardly compatible with global simulations over decades. Nevertheless the influence of these processes will have to be investigated in the future and compared to the advective signal.
In agreement with widespread, although scarce, deep observations of small microplastics in the Atlantic, Pacific and Arctic Oceans (Egger et al., 2020; Pabortsava and Lampitt, 2020; Ross et al., 2021; Vega-Moreno et al., 2021; Zhao et al., 2022), our results show that the water column may be a very large reservoir of neutrally buoyant plastics, either because of their very small size (nanoplastics), or shape (fibers), or because of biofouling affecting their buoyancy (Kvale et al., 2020; Lobelle et al., 2021). Obviously, 3D dispersion experiments lead to much lower plastic concentration levels than 2D surface simulations because of the distribution of plastics throughout the water column, so probably less harmful to marine organisms—however it challenges any attempt to collect plastics once they are released at sea, inciting initiatives addressed to more efficient recovery at the source regions near river mouths. This very first step in the 3D physical dispersion of neutral plastics in the global ocean requires more elaborate studies to consider particles (polymers) of different densities and to model the evolution of their buoyancy in the course of plastics life at sea, especially in relation with biological processes as already initiated by Lobelle et al. (2021) for instance—the complexity of the problem is definitely challenging!
Data Availability Statement
The raw data supporting the conclusion of this article will be made available by the authors, without undue reservation.
Author Contributions
All authors listed have made a substantial, direct, and intellectual contribution to the work and approved it for publication.
Funding
This work was supported by ISblue project, Interdisciplinary graduate school for the blue planet (ANR-17-EURE-0015), and co-funded by a grant from the French government under the program “Investissements d’Avenir”. This work was granted access to the HPC resources of the french supercomputing center IDRIS under the allocations 2021-AP010113079 for the Ariane experiments and A0090101279 for the NEMO eORCA12 simulations made by GENCI.
Conflict of Interest
The authors declare that the research was conducted in the absence of any commercial or financial relationships that could be construed as a potential conflict of interest.
Publisher’s Note
All claims expressed in this article are solely those of the authors and do not necessarily represent those of their affiliated organizations, or those of the publisher, the editors and the reviewers. Any product that may be evaluated in this article, or claim that may be made by its manufacturer, is not guaranteed or endorsed by the publisher.
Acknowledgments
Special thanks to IDRIS support for their help and tolerance with postprocessing usage. We wish to acknowledge the very detailed and constructive comments from the two reviewers who did a remarkable job to improve and complement the original version of the paper.
References
Arakawa, A., and Lamb, V. R.Computational Design of the Basic Dynamical Processes of the ucla General Circulation Model. In: J. Chang, editor. General Circulation Models of the Atmosphere. Vol. 17 of Methods in Computational Physics: Advances in Research and Applications. Amsterdam, Netherlands: Elsevier (1977). p. 173–265. doi:10.1016/B978-0-12-460817-7.50009-4
Arhan, M., De Verdiere, A. C., and Mercier, H.Direct Observations of the Mean Circulation at 48°N in the Atlantic Ocean. J. Phys. Oceanogr. (1989) 19:161–181. doi:10.1175/1520-0485(1989)019<0161:DOOTMC>2.0.CO;2
Artana, C., Ferrari, R., Bricaud, C., Lellouche, J.-M., Garric, G., Sennéchael, N., et al. Twenty-five Years of Mercator Ocean Reanalysis GLORYS12 at Drake Passage: Velocity Assessment and Total Volume Transport. Adv. Space Res. (2021) 68:447–466. doi:10.1016/j.asr.2019.11.033
Bernard, B., Madec, G., Penduff, T., Molines, J.-M., Treguier, A.-M., Le Sommer, J., et al. Impact of Partial Steps and Momentum Advection Schemes in a Global Ocean Circulation Model at Eddy-Permitting Resolution. Ocean Dyn. (2006) 56:543–567. doi:10.1007/s10236-006-0082-1
Blanke, B., Arhan, M., Speich, S., and Pailler, K.Diagnosing and Picturing the North Atlantic Segment of the Global Conveyor Belt by Means of an Ocean General Circulation Model. J. Phys. Oceanogr. (2002a) 32:1430–1451. doi:10.1175/1520-0485(2002)032<1430:DAPTNA>2.0.CO;2
Blanke, B., and Delecluse, P.Variability of the Tropical Atlantic Ocean Simulated by a General Circulation Model with Two Different Mixed-Layer Physics. J. Phys. Oceanogr. (1993) 23:1363–1388. doi:10.1175/1520-0485(1993)023<1363:vottao>2.0.co;2
Blanke, B., and Raynaud, S.Kinematics of the Pacific Equatorial Undercurrent: an Eulerian and Lagrangian Approach from GCM Results. J. Phys. Oceanogr. (1997) 27:1038–1053. doi:10.1175/1520-0485(1997)027<1038:KOTPEU>2.0.CO;2
Blanke, B., Speich, S., Madec, G., and Döös, K.A Global Diagnostic of Interocean Mass Transfers. J. Phys. Oceanogr. (2001) 31:1623–1632. doi:10.1175/1520-0485(2001)031<1623:AGDOIM>2.0.CO;2
Blanke, B., Speich, S., Madec, G., and Maugé, R.A Global Diagnostic of interior Ocean Ventilation. Geophys. Res. Lett. (2002b) 29:108. doi:10.1029/2001GL013727
Borrelle, S. B., Ringma, J., Law, K. L., Monnahan, C. C., Lebreton, L., McGivern, A., et al. Predicted Growth in Plastic Waste Exceeds Efforts to Mitigate Plastic Pollution. Science (2020) 369:1515–1518. doi:10.1126/science.aba3656
Bryden, H. L.Geostrophic Vorticity Balance in Midocean. J. Geophys. Res. (1980) 85:2825–2828. doi:10.1029/jc085ic05p02825
Chassignet, E. P., Xu, X., and Zavala-Romero, O.Tracking marine Litter with a Global Ocean Model: Where Does it Go? where Does it Come from? Front. Mar. Sci. (2021) 8:667591. doi:10.3389/fmars.2021.667591
Chenillat, F., Huck, T., Maes, C., Grima, N., and Blanke, B.Fate of Floating Plastic Debris Released along the Coasts in a Global Ocean Model. Mar. Pollut. Bull. (2021) 165:112116. doi:10.1016/j.marpolbul.2021.112116
Cózar, A., Echevarría, F., González-Gordillo, J. I., Irigoien, X., Úbeda, B., Hernández-León, S., et al. Plastic Debris in the Open Ocean. Proc. Natl. Acad. Sci. U.S.A. (2014) 111:10239–10244. doi:10.1073/pnas.1314705111
Dobler, D., Huck, T., Maes, C., Grima, N., Blanke, B., Martinez, E., et al. Large Impact of Stokes Drift on the Fate of Surface Floating Debris in the South Indian Basin. Mar. Pollut. Bull. (2019) 148:202–209. doi:10.1016/j.marpolbul.2019.07.057
Egger, M., Sulu-Gambari, F., and Lebreton, L.First Evidence of Plastic Fallout from the North Pacific Garbage Patch. Sci. Rep. (2020) 10:7495. doi:10.1038/s41598-020-64465-8
Eriksen, M., Lebreton, L. C. M., Carson, H. S., Thiel, M., Moore, C. J., Borerro, J. C., et al. Plastic Pollution in the World's Oceans: More Than 5 Trillion Plastic Pieces Weighing over 250,000 Tons Afloat at Sea. PLoS ONE (2014) 9:e111913. doi:10.1371/journal.pone.0111913
Fischer, R., Lobelle, D., Kooi, M., Koelmans, A., Onink, V., Laufkötter, C., et al. Modeling Submerged Biofouled Microplastics and Their Vertical Trajectories. Biogeosciences Discuss. (2021). in review. doi:10.5194/bg-2021-236
Fraser, C. I., Morrison, A. K., Hogg, A. M., Macaya, E. C., Van Sebille, E., Ryan, P. G., et al. Antarctica's Ecological Isolation Will Be Broken by Storm-Driven Dispersal and Warming. Nat. Clim Change (2018) 8:704–708. doi:10.1038/s41558-018-0209-7
Gago, J., Carretero, O., Filgueiras, A. V., and Viñas, L.Synthetic Microfibers in the marine Environment: a Review on Their Occurrence in Seawater and Sediments. Mar. Pollut. Bull. (2018) 127:365–376. doi:10.1016/j.marpolbul.2017.11.070
Gennip, S. J. v., Dewitte, B., Garçon, V., Thiel, M., Popova, E., Drillet, Y., et al. In Search for the Sources of Plastic marine Litter that Contaminates the Easter Island Ecoregion. Sci. Rep. (2019) 9. doi:10.1038/s41598-019-56012-x
GESAMP. Sources, Fate and Effects of Microplastics in the marine Environment: a Global Assessment. Tech. Rep. (2015) 90. IMO/FAO/UNESCO-IOC/UNIDO/WMO/IAEA/UN/UNEP/UNDP Joint Group of Experts on the Scientific Aspects of Marine Environmental Protection, Rep. Stud. GESAMP.
Geyer, R., Jambeck, J. R., and Law, K. L.Production, Use, and Fate of All Plastics Ever Made. Sci. Adv. (2017) 3:e1700782. doi:10.1126/sciadv.1700782
Good, S. A., Martin, M. J., and Rayner, N. A.EN4: Quality Controlled Ocean Temperature and Salinity Profiles and Monthly Objective Analyses with Uncertainty Estimates. J. Geophys. Res. Oceans (2013) 118:6704–6716. doi:10.1002/2013JC009067
Hanawa, K., and D.Talley, L.Chapter 5.4 Mode Waters. In: G. Siedler, J. Gould, and J. Church, editors. Ocean Circulation and Climate - Observing and Modelling the Global Ocean. Vol. 77 of International Geophysics. Oxford: Academic Press (2001). p. 373–386. doi:10.1016/S0074-6142(01)80129-7
Huang, R. X.Oceanographic Topics | Surface/wind Driven Circulation. In: G. R. North, J. Pyle, and F. Zhang, editors. Encyclopedia of Atmospheric Sciences (Second Edition). Second edition. Oxford: Academic Press (2015). p. 301–314. doi:10.1016/B978-0-12-382225-3.00280-2
Jalón-Rojas, I., Wang, X. H., and Fredj, E.A 3D Numerical Model to Track Marine Plastic Debris (TrackMPD): Sensitivity of Microplastic Trajectories and Fates to Particle Dynamical Properties and Physical Processes. Mar. Pollut. Bull. (2019) 141:256–272. doi:10.1016/j.marpolbul.2019.02.052
Jambeck, J. R., Geyer, R., Wilcox, C., Siegler, T. R., Perryman, M., Andrady, A., et al. Plastic Waste Inputs from Land into the Ocean. Science (2015) 347:768–771. doi:10.1126/science.1260352
Klein, P., and Lapeyre, G.The Oceanic Vertical Pump Induced by Mesoscale and Submesoscale Turbulence. Annu. Rev. Mar. Sci. (2009) 1:351–375. doi:10.1146/annurev.marine.010908.163704
Kooi, M., Nes, E. H. v., Scheffer, M., and Koelmans, A. A.Ups and downs in the Ocean: Effects of Biofouling on Vertical Transport of Microplastics. Environ. Sci. Technol. (2017) 51:7963–7971. doi:10.1021/acs.est.6b04702
Kubota, M.A Mechanism for the Accumulation of Floating Marine Debris North of Hawaii. J. Phys. Oceanogr. (1994) 24:1059–1064. doi:10.1175/1520-0485(1994)024<1059:amftao>2.0.co;2
Kukulka, T., Proskurowski, G., Morét-Ferguson, S., Meyer, D. W., and Law, K. L.The Effect of Wind Mixing on the Vertical Distribution of Buoyant Plastic Debris. Geophys. Res. Lett. (2012) 39:a–n. doi:10.1029/2012GL051116
Kvale, K., Prowe, A. E. F., Chien, C.-T., Landolfi, A., and Oschlies, A.The Global Biological Microplastic Particle Sink. Sci. Rep. (2020) 10:16670. doi:10.1038/s41598-020-72898-4
Le Sommer, J., Penduff, T., Theetten, S., Madec, G., and Barnier, B.How Momentum Advection Schemes Influence Current-Topography Interactions at Eddy Permitting Resolution. Ocean Model. (2009) 29:1–14. doi:10.1016/j.ocemod.2008.11.007
Lebreton, L. C.-M., and Borrero, J. C.Modeling the Transport and Accumulation Floating Debris Generated by the 11 March 2011 Tohoku Tsunami. Mar. Pollut. Bull. (2013) 66:53–58. doi:10.1016/j.marpolbul.2012.11.013
Lebreton, L. C.-M., Greer, S. D., and Borrero, J. C.Numerical Modelling of Floating Debris in the World's Oceans. Mar. Pollut. Bull. (2012) 64:653–661. doi:10.1016/j.marpolbul.2011.10.027
Lebreton, L. C. M., van der Zwet, J., Damsteeg, J.-W., Slat, B., Andrady, A., and Reisser, J.River Plastic Emissions to the World's Oceans. Nat. Commun. (2017) 8:15611. doi:10.1038/ncomms15611
Lebreton, L., Egger, M., and Slat, B.A Global Mass Budget for Positively Buoyant Macroplastic Debris in the Ocean. Sci. Rep. (2019) 9:12922. doi:10.1038/s41598-019-49413-5
[Dataset] Lebreton, l., and Reisser, J.Supplementary Data for ’River Plastic Emissions to the World’s Oceans’. Dataset (2018). doi:10.6084/m9.figshare.4725541
Lebreton, L., Slat, B., Ferrari, F., Sainte-Rose, B., Aitken, J., Marthouse, R., et al. Evidence that the Great Pacific Garbage Patch Is Rapidly Accumulating Plastic. Sci. Rep. (2018) 8:2045–2322. doi:10.1038/s41598-018-22939-w
Lobelle, D., Kooi, M., Koelmans, A. A., Laufkötter, C., Jongedijk, C. E., Kehl, C., et al. Global Modeled Sinking Characteristics of Biofouled Microplastic. J. Geophys. Res. Oceans (2021) 126. doi:10.1029/2020JC017098
Madec, G.NEMO Ocean General Circulation Model Reference Manual. Tech. Rep. (2012) 27. Note du Pôle de modélisation, Institut Pierre-Simon Laplace (IPSL), Paris, France.
Maes, C., Grima, N., Blanke, B., Martinez, E., Paviet-Salomon, T., and Huck, T.A Surface “Superconvergence” Pathway Connecting the South Indian Ocean to the Subtropical South Pacific Gyre. Geophys. Res. Lett. (2018) 45:1915–1922. doi:10.1002/2017GL076366
Marsh, R., Ivchenko, V. O., Skliris, N., Alderson, S., Bigg, G. R., Madec, G., et al. NEMO-ICB (v1.0): Interactive Icebergs in the NEMO Ocean Model Globally Configured at Eddy-Permitting Resolution. Geosci. Model. Dev. (2015) 8:1547–1562. doi:10.5194/gmd-8-1547-2015
Martinez, E., Maamaatuaiahutapu, K., and Taillandier, V.Floating marine Debris Surface Drift: Convergence and Accumulation toward the South Pacific Subtropical Gyre. Mar. Pollut. Bull. (2009) 58:1347–1355. doi:10.1016/j.marpolbul.2009.04.022
Mathiot, P., Jenkins, A., Harris, C., and Madec, G.Explicit Representation and Parametrised Impacts of under Ice Shelf Seas in the Z∗ Coordinate Ocean Model NEMO 3.6. Geosci. Model. Dev. (2017) 10:2849–2874. doi:10.5194/gmd-10-2849-2017
Maximenko, N., Hafner, J., Kamachi, M., and MacFadyen, A.Numerical Simulations of Debris Drift from the Great Japan Tsunami of 2011 and Their Verification with Observational Reports. Mar. Pollut. Bull. (2018) 132:5–25. doi:10.1016/j.marpolbul.2018.03.056
Maximenko, N., Hafner, J., and Niiler, P.Pathways of marine Debris Derived from Trajectories of Lagrangian Drifters. Mar. Pollut. Bull. (2012) 65:51–62. doi:10.1016/j.marpolbul.2011.04.016
Meijer, L. J. J., van Emmerik, T., van der Ent, R., Schmidt, C., and Lebreton, L.More Than 1000 Rivers Account for 80% of Global Riverine Plastic Emissions into the Ocean. Sci. Adv. (2021) 7:eaaz5803. doi:10.1126/sciadv.aaz5803
Mheen, M., Pattiaratchi, C., and Sebille, E.Role of Indian Ocean Dynamics on Accumulation of Buoyant Debris. J. Geophys. Res. Oceans (2019) 124:2571–2590. doi:10.1029/2018JC014806
Mountford, A. S., and Morales Maqueda, M. A.Eulerian Modeling of the Three‐Dimensional Distribution of Seven Popular Microplastic Types in the Global Ocean. J. Geophys. Res. Oceans (2019) 124:8558–8573. doi:10.1029/2019JC015050
Onink, V., Jongedijk, C. E., Hoffman, M. J., van Sebille, E., and Laufkötter, C.Global Simulations of marine Plastic Transport Show Plastic Trapping in Coastal Zones. Environ. Res. Lett. (2021) 16:064053. doi:10.1088/1748-9326/abecbd
Onink, V., van Sebille, E., and Laufkötter, C.Empirical Lagrangian Parametrization for Wind-Driven Mixing of Buoyant Particles at the Ocean Surface. Geosci. Model. Dev. (2022) 15:1995–2012. doi:10.5194/gmd-15-1995-2022
Onink, V., Wichmann, D., Delandmeter, P., and Sebille, E.The Role of Ekman Currents, Geostrophy, and Stokes Drift in the Accumulation of Floating Microplastic. J. Geophys. Res. Oceans (2019) 124:1474–1490. doi:10.1029/2018JC014547
Pabortsava, K., and Lampitt, R. S.High Concentrations of Plastic Hidden beneath the Surface of the Atlantic Ocean. Nat. Commun. (2020) 11:4073. doi:10.1038/s41467-020-17932-9
Pattiaratchi, C., van der Mheen, M., Schlundt, C., Narayanaswamy, B. E., Sura, A., Hajbane, S., et al. Plastics in the Indian Ocean - Sources, Transport, Distribution, and Impacts. Ocean Sci. (2022) 18:1–28. doi:10.5194/os-18-1-2022
Penduff, T., Le Sommer, J., Barnier, B., Treguier, A.-M., Molines, J.-M., and Madec, G.Influence of Numerical Schemes on Current-Topography Interactions in 1/4° Global Ocean Simulations. Ocean Sci. (2007) 3:509–524. doi:10.5194/os-3-509-2007
Plastics Europe. Plastics – the Facts 2019. An Analysis of European Plastics Production, Demand and Waste Data. Tech. rep., Plastics Europe (2019).
Portela, E., Kolodziejczyk, N., Vic, C., and Thierry, V.Physical Mechanisms Driving Oxygen Subduction in the Global Ocean. Geophys. Res. Lett. (2020) 47:e2020GL089040. doi:10.1029/2020GL089040
Poulain, M., Mercier, M. J., Brach, L., Martignac, M., Routaboul, C., Perez, E., et al. Small Microplastics as a Main Contributor to Plastic Mass Balance in the North Atlantic Subtropical Gyre. Environ. Sci. Technol. (2019) 53:1157–1164. doi:10.1021/acs.est.8b05458
Reisser, J., Slat, B., Noble, K., du Plessis, K., Epp, M., Proietti, M., et al. The Vertical Distribution of Buoyant Plastics at Sea: an Observational Study in the North Atlantic Gyre. Biogeosciences (2015) 12:1249–1256. doi:10.5194/bg-12-1249-2015
Rhein, M., Fischer, J., Smethie, W. M., Smythe-Wright, D., Weiss, R. F., Mertens, C., et al. Labrador Sea Water: Pathways, CFC Inventory, and Formation Rates. J. Phys. Oceanogr. (2002) 32:648–665. doi:10.1175/1520-0485(2002)032<0648:lswpci>2.0.co;2
Rhein, M., Kieke, D., and Steinfeldt, R.Advection of N Orth A Tlantic D Eep W Ater from the L Abrador S Ea to the Southern Hemisphere. J. Geophys. Res. Oceans (2015) 120:2471–2487. doi:10.1002/2014JC010605
Ross, P. S., Chastain, S., Vassilenko, E., Etemadifar, A., Zimmermann, S., Quesnel, S.-A., et al. Pervasive Distribution of Polyester Fibres in the Arctic Ocean Is Driven by Atlantic Inputs. Nat. Commun. (2021) 12:106. doi:10.1038/s41467-020-20347-1
Schmidt, C., Krauth, T., and Wagner, S.Export of Plastic Debris by Rivers into the Sea. Environ. Sci. Technol. (2017) 51:12246–12253. doi:10.1021/acs.est.7b02368
Sévellec, F., Naveira Garabato, A. C., Brearley, J. A., and Sheen, K. L.Vertical Flow in the Southern Ocean Estimated from Individual Moorings. J. Phys. Oceanogr. (2015) 45:2209–2220. doi:10.1175/JPO-D-14-0065.1
Speich, S., Blanke, B., and Cai, W.Atlantic Meridional Overturning Circulation and the Southern Hemisphere Supergyre. Geophys. Res. Lett. (2007) 34:a–n. doi:10.1029/2007GL031583
Talley, L. D.Some Aspects of Ocean Heat Transport by the Shallow, Intermediate and Deep Overturning Circulations. In: U. Clark, R. S. Webb, and L. D. Keigwin, editors. Mechanisms of Global Climate Change at Millenial Time Scales, Geophys. Mono. Ser., Vol. 112. Washington, D.C., USA: American Geophysical Union (1999). p. 1–22. doi:10.1029/gm112p0001
Tekman, M. B., Wekerle, C., Lorenz, C., Primpke, S., Hasemann, C., Gerdts, G., et al. Tying up Loose Ends of Microplastic Pollution in the Arctic: Distribution from the Sea Surface through the Water Column to Deep-Sea Sediments at the HAUSGARTEN Observatory. Environ. Sci. Technol. (2020) 54:4079–4090. doi:10.1021/acs.est.9b06981
Tsujino, H., Urakawa, S., Nakano, H., Small, R. J., Kim, W. M., Yeager, S. G., et al. JRA-55 Based Surface Dataset for Driving Ocean-Sea-Ice Models (JRA55-Do). Ocean Model. (2018) 130:79–139. doi:10.1016/j.ocemod.2018.07.002
Tuerena, R. E., Williams, R. G., Mahaffey, C., Vic, C., Green, J. A. M., Naveira‐Garabato, A., et al. Internal Tides Drive Nutrient Fluxes into the Deep Chlorophyll Maximum over Mid‐ocean Ridges. Glob. Biogeochem. Cycles (2019) 33:995–1009. doi:10.1029/2019GB006214
van der Mheen, M., van Sebille, E., and Pattiaratchi, C.Beaching Patterns of Plastic Debris along the Indian Ocean Rim. Ocean Sci. (2020) 16:1317–1336. doi:10.5194/os-16-1317-2020
van Sebille, E., Aliani, S., Law, K. L., Maximenko, N., Alsina, J. M., Bagaev, A., et al. The Physical Oceanography of the Transport of Floating marine Debris. Environ. Res. Lett. (2020) 15:023003. doi:10.1088/1748-9326/ab6d7d
van Sebille, E., England, M. H., and Froyland, G.Origin, Dynamics and Evolution of Ocean Garbage Patches from Observed Surface Drifters. Environ. Res. Lett. (2012) 7:044040. doi:10.1088/1748-9326/7/4/044040
van Sebille, E., Wilcox, C., Lebreton, L., Maximenko, N., Hardesty, B. D., van Franeker, J. A., et al. A Global Inventory of Small Floating Plastic Debris. Environ. Res. Lett. (2015) 10:124006. doi:10.1088/1748-9326/10/12/124006
Vega-Moreno, D., Abaroa-Pérez, B., Rein-Loring, P. D., Presas-Navarro, C., Fraile-Nuez, E., and Machín, F.Distribution and Transport of Microplastics in the Upper 1150 M of the Water Column at the Eastern North Atlantic Subtropical Gyre, Canary Islands, Spain. Sci. Total Environ. (2021) 788:147802. doi:10.1016/j.scitotenv.2021.147802
Weiss, L., Ludwig, W., Heussner, S., Canals, M., Ghiglione, J.-F., Estournel, C., et al. The Missing Ocean Plastic Sink: Gone with the Rivers. Science (2021) 373:107–111. doi:10.1126/science.abe0290
Wichmann, D., Delandmeter, P., and van Sebille, E.Influence of Near‐Surface Currents on the Global Dispersal of Marine Microplastic. J. Geophys. Res. Oceans (2019) 124:6086–6096. doi:10.1029/2019JC015328
Woodall, L. C., Sanchez-Vidal, A., Canals, M., Paterson, G. L. J., Coppock, R., Sleight, V., et al. The Deep Sea Is a Major Sink for Microplastic Debris. R. Soc. Open Sci. (2014) 1:140317. doi:10.1098/rsos.140317
Wright, S. L., Thompson, R. C., and Galloway, T. S.The Physical Impacts of Microplastics on marine Organisms: A Review. Environ. Pollut. (2013) 178:483–492. doi:10.1016/j.envpol.2013.02.031
Keywords: marine debris, microplastics, nanoplastics, Lagrangian analysis, dispersion, global ocean
Citation: Huck T, Bajon R, Grima N, Portela E, Molines J-M and Penduff T (2022) Three-Dimensional Dispersion of Neutral “Plastic” Particles in a Global Ocean Model. Front. Anal. Sci. 2:868515. doi: 10.3389/frans.2022.868515
Received: 02 February 2022; Accepted: 29 March 2022;
Published: 29 April 2022.
Edited by:
Javier Hernández-Borges, University of La Laguna, SpainReviewed by:
Francisco Machín, University of Las Palmas de Gran Canaria, SpainDelphine Lobelle, Utrecht University, Netherlands
Copyright © 2022 Huck, Bajon, Grima, Portela, Molines and Penduff. This is an open-access article distributed under the terms of the Creative Commons Attribution License (CC BY). The use, distribution or reproduction in other forums is permitted, provided the original author(s) and the copyright owner(s) are credited and that the original publication in this journal is cited, in accordance with accepted academic practice. No use, distribution or reproduction is permitted which does not comply with these terms.
*Correspondence: Thierry Huck, thuck@univ-brest.fr