
Advertisement
Advertisement
AUD/USD Forex Technical Analysis – Continues to Strengthen Over .7307, Weakens Under .7252
By:
Based on the current price at .7273, the direction of the AUD/USD the rest of the session is likely to be determined by trader reaction to the support cluster at .7252. This is a combination of a downtrending Gann angle and the major 50% level at .7252.

The Australian Dollar is trading higher against the U.S. Dollar early Thursday on the back of a surge in Australian employment in October. Earlier in the session, the Aussie was underpinned by increased demand for risk as the UK and the EU inched closer to deal over Brexit.
According to a government report, the Employment Change showed the economy added 32.8K. Traders were looking for an increase of 19.9K. The previous month was revised higher to 7.8K. The Unemployment Rate stayed the same at 5.0%, but better than the 5.1% estimate.
At 0421 GMT, the AUD/USD is trading .7273, up 0.0040 or +0.55%.
The Australian Dollar is rallying because traders are now pricing in about a 40 percent chance of a rate hike in August next year, up from 25 percent before the data.
Daily Technical Analysis
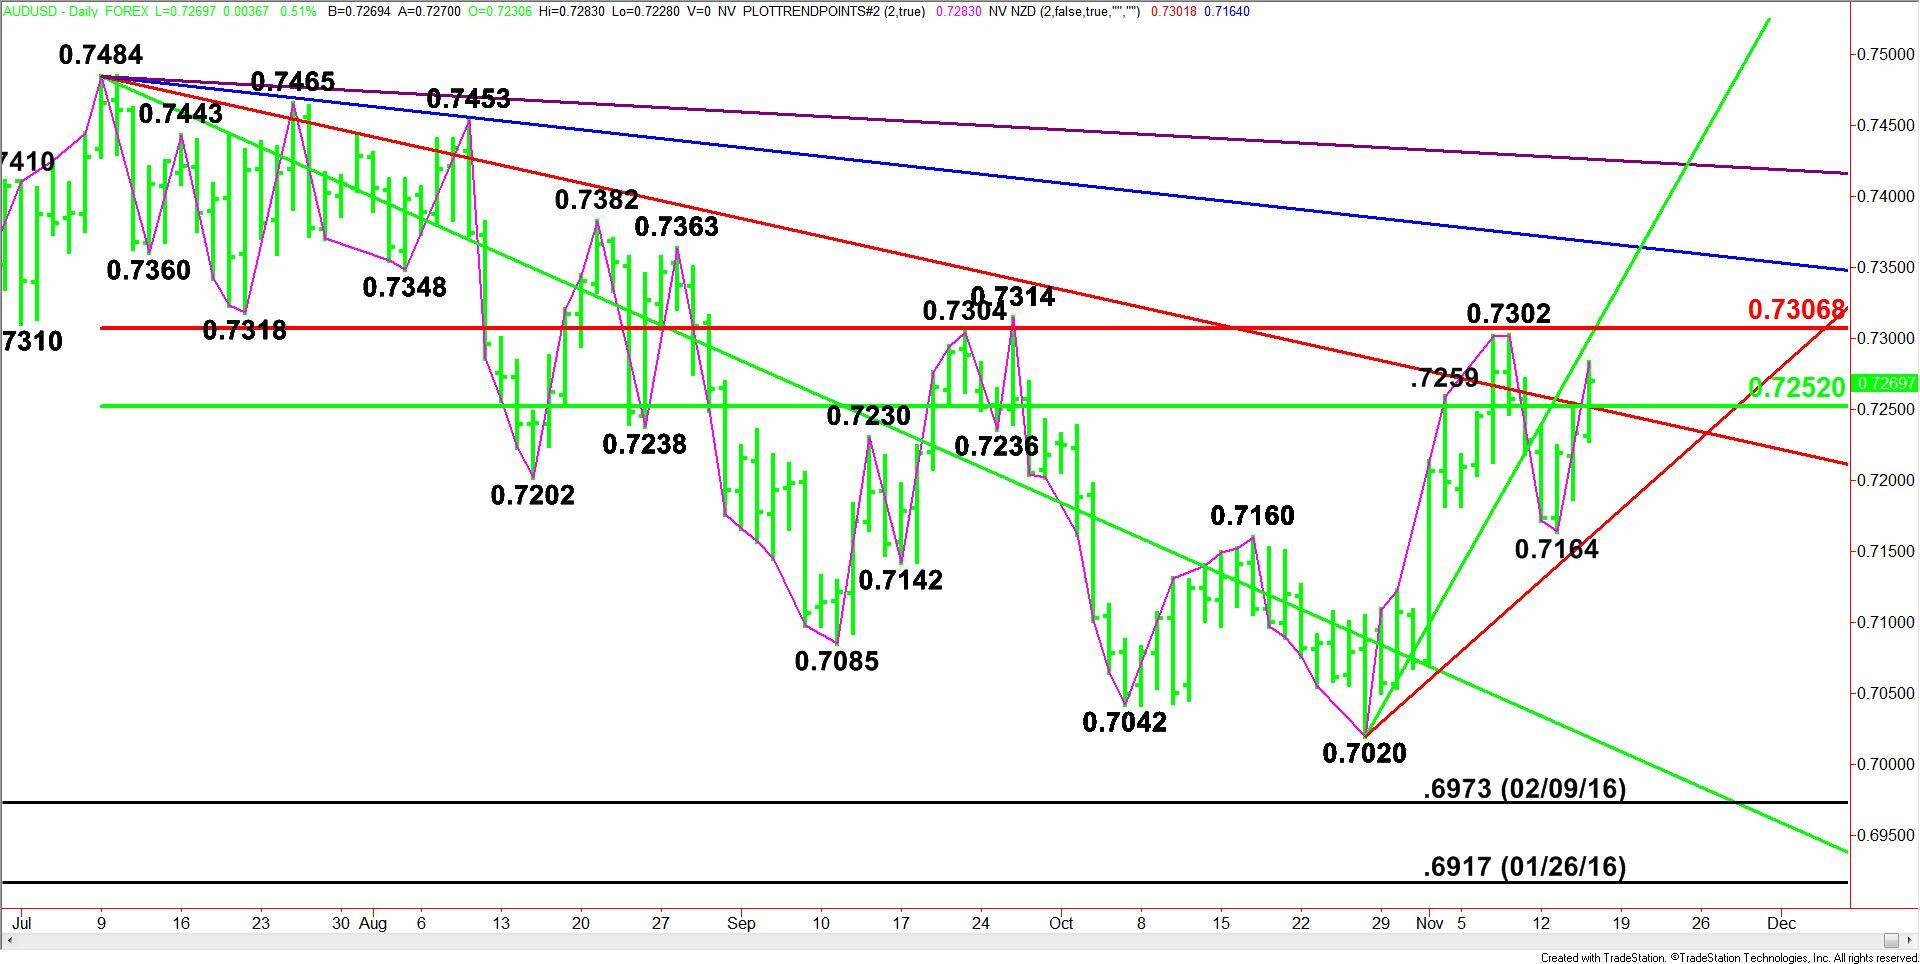
The main trend is up according to the daily swing chart. Today’s price action has created a new main bottom at .7164. A trade through this level will change the main trend to down. A move through .7302 will reaffirm the uptrend.
Taking out the swing top at .7314 will indicate the buying is getting stronger with the next targets coming in at .7363 and .7382.
The main range is .7484 to .7020. The market is currently testing its retracement zone at .7252 to .7307. This zone is controlling the near-term direction of the AUD/USD.
Daily Technical Forecast
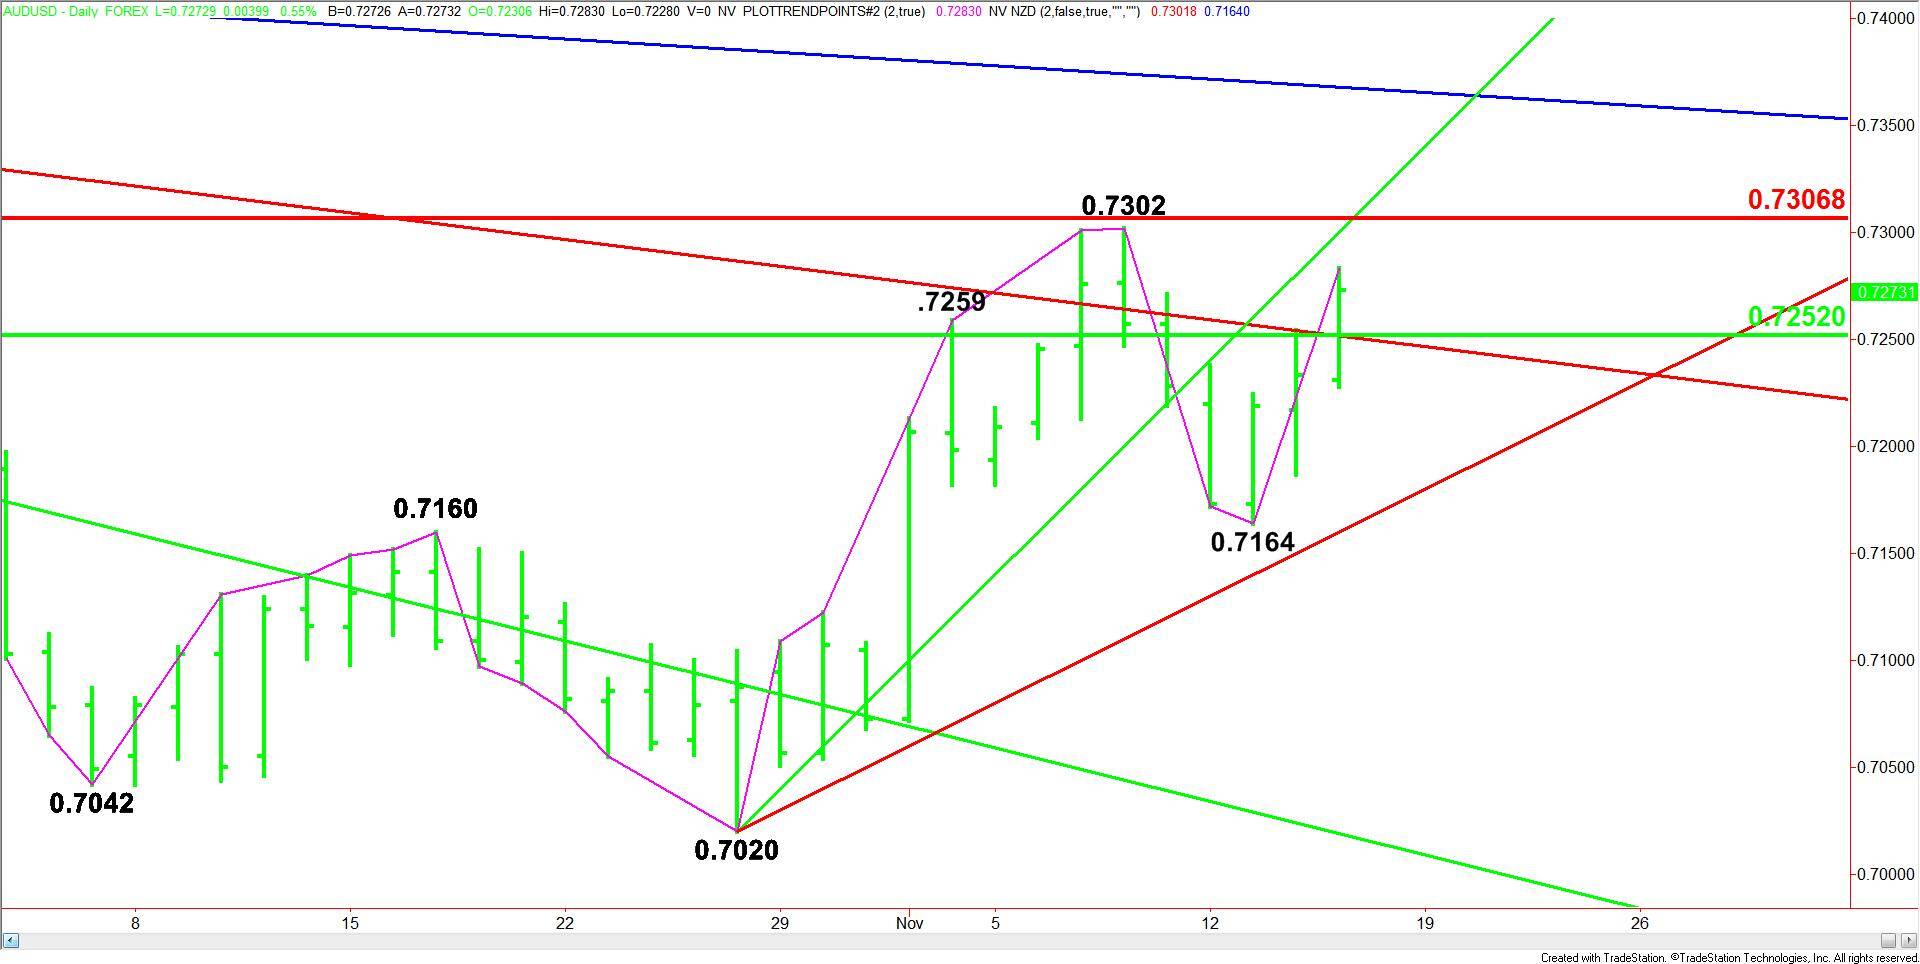
Based on the current price at .7273, the direction of the AUD/USD the rest of the session is likely to be determined by trader reaction to the support cluster at .7252. This is a combination of a downtrending Gann angle and the major 50% level at .7252.
Bullish Scenario
A sustained move over .7252 will indicate the presence of buyers. If this move creates enough upside momentum then look for the rally to extend into an uptrending Gann angle at .7300, the main top at .7302 and the Fibonacci level at .7307.
Crossing to the strong side of the angle at .7300 and the Fib level at .7307 will put the AUD/USD in a bullish position.
Bearish Scenario
A sustained move under .7252 will signal the presence of sellers. This could generate the downside pressure to trigger a retest of the main bottom at .7164, followed by an uptrending Gann angle at .7160.
About the Author
James Hyerczykauthor
James is a Florida-based technical analyst, market researcher, educator and trader with 35+ years of experience. He is an expert in the area of patterns, price and time analysis as it applies to futures, Forex, and stocks.
Did you find this article useful?
Latest news and analysis


Advertisement