Biologically produced materials are becoming a progressively vital component in numerous industrial processes, including those related to pharmaceuticals, food, diagnostics and fuels.
Most of these biologicals generate in fermenters and bioreactors where specialized cell cultures grow and produce the molecule of interest.
Various types of cells are used in culturing and manufacturing biopharmaceutical products, including genetically engineered bacterial and yeast cells.
However, most of the products are proteins cultured from mammalian systems such as Chinese hamster ovary (CHO), green monkey (VERO) or human embryonic kidney (HEK) cell lines.
Most of these products are vast complex proteins, hormones or polysaccharides that are difficult or impossible to manufacture in significant quantities in any other way.
A recent survey of the U.S. Food and Drug Administration established that there are over 350 biologicals authorized for various uses, including diagnostic and therapeutically important antibodies as well as vaccines.
Bioprocesses that create the materials desired by nature depend on complex biological systems to synthesize their useful characteristics.
While conventional chemical manufacturing processes have little relative variability, variability from batch to batch becomes inevitable due to the inherent complexity of biological systems.
Due to the complexity and variability of the processes, it has been calculated that a 10-fold loss in profit results from the fact that around 30% of the production batches need to be reprocessed for quality reasons.
Industries that depend on these complex biological systems take great advantage from closely monitoring cell culture growth and the production of the target molecule.
Process Analytical Technology (PAT) initiatives in bioprocesses enhance the overall product quality and minimize waste by reducing and accounting for this inherent variability.
Monitoring and controlling cell culture conditions significantly reduces such variability and produces enhanced target protein production.
Fourier transform near-infrared (FT-NIR) spectroscopy has shown itself to be a useful technology for the monitoring and control of manufacturing processes, including more detailed bioprocess applications. It is also part of PAT initiatives across many industries, including bioprocessing.
Previous work performed on cell cultures using NIR spectroscopy has typically cast a lens on controlling and monitoring nutrients, cell densities, waste products and other parameters related to the cell culture’s health.
While these parameters are beneficial for establishing the relative health of the cell culture, the most crucial parameter of interest is the actual concentration and production of the target molecule.
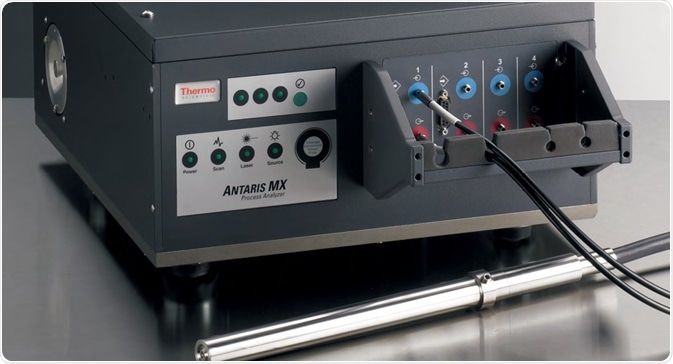
Figure 1. Antaris MX FT-NIR Process Analyzer used for collecting the spectroscopic information from the cell cultures. Image Credit: Thermo Fisher Scientific – Materials & Structural Analysis
Just a few NIR studies have identified and measured protein concentrations in real cell culture conditions.
This application note outlines the feasibility of using the Thermo Scientific™ Antaris™ MX FT-NIR Process Analyzer (Figure 1) to determine predictions for protein concentrations at biologically relevant concentrations in dynamic cell cultures.
NIR spectroscopy utilizes light between 10,000 and 4000 cm-1 to establish the identity and quantity of a wide range of materials. Many molecules of interest absorb light in this region via combination or overtone vibrations.
The benefit of conducting spectral analysis on these absorption bands is that the light has the capacity to penetrate more deeply into the material subjected to analysis and doesn’t necessitate dilution or manipulation of the sample.
Therefore, NIR analyzers can be directly coupled into a process tank or stream where spectral analysis can be conducted without human intervention.
Fourier transform NIR has been applied in various industrial, pharmaceutical and other process settings for a number of years and has proved to be helpful in the automated collection of real-time analytical data.
When employed in process environments, the Antaris MX Process Analyzer can be coupled to process control computers, a key component in maintaining optimal manufacturing conditions.
Thanks to these benefits and the necessity to control the inherently variable biological systems found in cell culture technologies, NIR is the desired choice for analyzing various components in bioreactors, including proteins.
Methods
Chinese hamster ovary (CHO) cell cultures were grown in the best possible conditions until the cell concentrations reached around one million per milliliter. This constitutes a typical cell density for a young and growing culture.
Samples of the cell culture were evaluated on a Nova BioProfile® analyzer to establish concentrations of glutamine, glucose, ammonia and lactate.
The concentrations of these materials varied throughout the experiment and accounted for some instabilities that might be observed across multiple cultures.
The concentrations were altered by either diluting the samples with unaltered cell culture or spiking the samples with waste products or nutrients.
Table 1. Concentration ranges of various components. The solutions represented over 35 different protein concentrations that also varied in concentrations of nutrient and waste components. Source: Thermo Fisher Scientific – Materials & Structural Analysis
| Component |
Range (g/L) |
| Protein |
0.16 – 5.00 |
| Glucose |
7.98 – 8.12 |
| Glutamine |
0.28 – 0.58 |
| Lactate |
0.45 – 0.90 |
| Ammonia |
0.05 – 2.39 |
Each of the four components were modified so that two or three different concentrations were represented for each. Table 1 shows the concentration ranges for the different nutrient, waste and protein components of the samples tested. This technique also has the effect of eliminating covariance between the various components and protein present.
Ultrapure bovine albumin protein was introduced to the solutions to represent target protein synthesized by the cells. Genetically modified cell cultures are geared towards producing the target protein in vast quantities, almost exclusively to all other cellular proteins.
Resultingly, the protein concentrations in the cell culture media will typically approach and exceed 5.0 g/L and be comprised of almost entirely of the target molecule.
Albumin protein is an excellent mimic for recombinant proteins because it is available in an extremely pure form and contains NIR active groups essentially identical to a typical target protein from a cell culture.
In this case, purity is vital because the presence of any extraneous material will also possess a NIR signal and would cause confounding results. The albumin protein material was weighed carefully and introduced to the cell cultures in concentrations ranging from 0.16 to 5.0 g/L.
Over 35 different solutions were created that had a diverse range of nutrients and waste as well as protein concentrations. These different solutions resulted in 54 spectra that were utilized in the construction of the chemometric method, and 20 spectra were used to authenticate that method.
Using an Antaris MX Process Analyzer, the cell culture samples were scanned in the range between 10,000 and 4000 cm-1. The analyzer was paired with a transflectance probe with an adjustable pathlength.
The gap distance was set at 1.25 mm for a total pathlength of 2.5 mm. Per spectrum, sixteen scans were collected and averaged using eight wavenumber resolutions with a gain of 0.1.
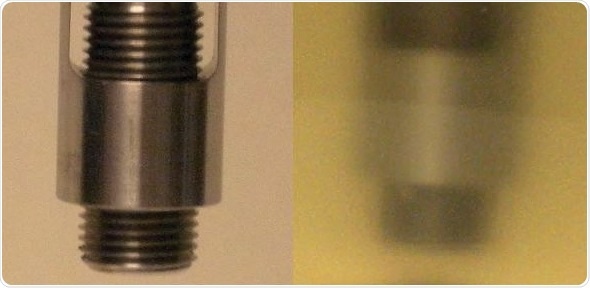
Figure 2. Transflectance probe used for data collection. Left panel shows the design of the probe with the adjustable pathlength. Right panel shows probe inserted into cell culture during data collection. Image Credit: Thermo Fisher Scientific – Materials & Structural Analysis
Sample time took roughly 15 seconds. Two spectra were gathered per sample. Figure 2 exhibits images of the probe prior to being inserted into a cell culture sample and during spectral collection.
The sample spectra were then loaded into Thermo Scientific™ TQ Analyst™ Software for chemometric analysis utilizing the Partial Least Squares (PLS) technique with a constant pathlength. Using a Norris smoothing filter, the spectra were evaluated in the first derivative.
Two regions were employed for the analysis: 8910 to 5340 cm-1 and 4830 to 4340 cm-1
These two regions gathered information across a broad range of data points while evading the totally attenuating water peak centered around 5100 cm-1: figure 3 displays representative raw spectra and the first derivative spectra of the samples.
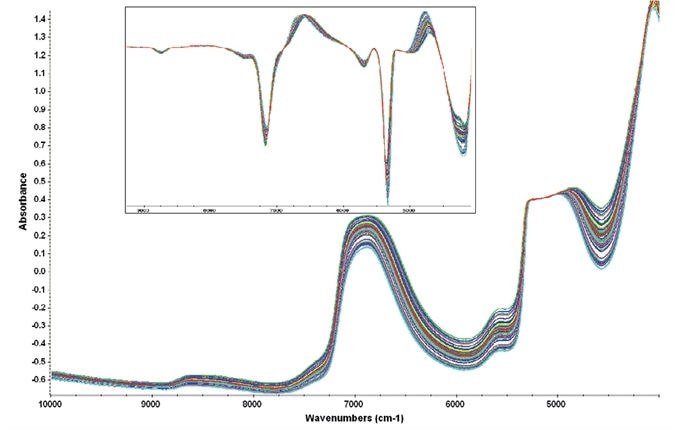
Figure 3. Representative raw spectra showing the variability present in the cell culture samples. Regions of analysis avoided the attenuated water peak at 5100 cm-1. Inset shows the first derivative spectra used for the PLS chemometric method. Image Credit: Thermo Fisher Scientific – Materials & Structural Analysis
Results
PLS analysis of the protein concentrations across the different cell culture samples demonstrated exceptional predictive capabilities across the range of materials tested.
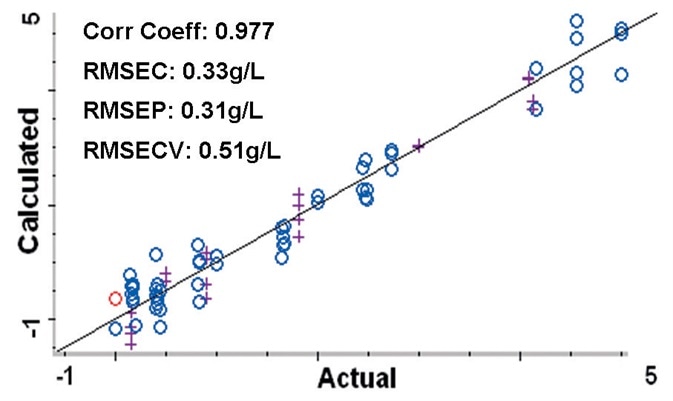
Figure 4. Calibration plot comparing the calculated protein concentrations to the actual concentrations from the PLS method. Root Mean Square Errors are approximately 0.5 g/L or less. Blue circles (o) represent spectra used to create the method, purple crosses (+) are spectra used to validate the method. Image Credit: Thermo Fisher Scientific – Materials & Structural Analysis
The 54 spectra used to develop the PLS method are displayed on a calibration plot (Figure 4) that contrasts the calculated protein concentrations against the true concentrations.
The calibration plot can be utilized to establish how well the method predicts the true protein concentrations in the samples. The plot created using the chemometric method resulted in a correlation coefficient of 0.977.
Root Mean Square Error of Calibration (RMSEC) was 0.33 g/L and the Root Mean Square Error of Prediction (RMSEP) measured across the 20 validation samples was 0.31 g/L. In addition, the Root Mean Square Error of Cross Validation (RMSECV) was 0.51 g/L.
These errors signal that the concentration of protein in the cell culture samples can be approximated to 0.5 g/L or less. Around a third of this error was based on the balance used to weigh the protein material.
Conclusions
Measuring protein concentrations in living dynamic cell cultures was conducted in a successful manner using the Antaris MX Process Analyzer. Protein concentration is a key parameter in establishing the success and quality of a cell culture in the production of a viable end product.
This NIR technique successfully shows the capacity to measure and monitor protein concentrations in real-time at appropriate concentrations.
The technique developed exhibits outstanding correlation with actual protein concentrations between 0.16 and 5.0 g/L with errors of lower than 0.5 g/L.
This application shows that the continued capacities of the Antaris FT-NIR Systems for effective use in bioprocess environments. It can automatically control and monitor cell cultures both safely and accurately.
While previous NIR studies have monitored cell culture conditions to support optimal protein production, few have genuinely monitored and predicted protein concentrations.
This feasibility study demonstrates the power of the Antaris FT-NIR Analyzer and its ability to appropriately predict target protein concentrations in a live and dynamic cell culture.
About Thermo Fisher Scientific – Materials & Structural Analysis
 Thermo Fisher Materials and Structural Analysis products give you outstanding capabilities in materials science research and development. Driving innovation and productivity, their portfolio of scientific instruments enable the design, characterization and lab-to-production scale of materials used throughout industry.
Sponsored Content Policy: News-Medical.net publishes articles and related content that may be derived from sources where we have existing commercial relationships, provided such content adds value to the core editorial ethos of News-Medical.Net which is to educate and inform site visitors interested in medical research, science, medical devices and treatments.