Abstract and Introduction
Introduction
The U.S. drug overdose epidemic continues to cause substantial morbidity and mortality. In 2017, 967,615 nonfatal drug overdoses were treated in emergency departments (EDs), a 4.3% increase from 2016 in all overdoses and a 3.1% increase in opioid-involved overdoses.[1] During 2017 and 2018, syndromic surveillance revealed that 37.2% of overdoses treated in EDs in 18 states involved multiple drugs.[2] To describe changes in rates and proportions of suspected nonfatal drug and polydrug overdoses treated in EDs, CDC analyzed syndromic surveillance data from 2018 to 2019 in 29 states. Rates of overdoses involving opioids, cocaine, and amphetamines increased 9.7%, 11.0%, and 18.3%, respectively, and the rate of benzodiazepine-involved overdoses decreased 3.0%. Overdoses co-involving opioids and amphetamines increased from 2018 to 2019, overall, in both sexes, and in most age groups. In 2019, 23.6%, 17.1%, and 18.7% of overdoses involving cocaine, amphetamine, and benzodiazepines, respectively, also involved opioids. Expanding overdose prevention, treatment, and response efforts is needed to reduce the number of drug and polydrug overdoses. This includes linkage into treatment, harm reduction services, and community-based programs for persons who use drugs; expanding overdose prevention efforts, including increased naloxone provision, to persons who use stimulants; addressing the illicit drug supply; and identifying specific risk factors for populations using these drugs. Continued surveillance with expanded coverage of additional jurisdictions of the evolving drug overdose epidemic is important to the success of these efforts.
Suspected nonfatal drug overdose ED visits were identified from 29 states* funded through CDC's Overdose Data to Action program† that submitted data to the National Syndromic Surveillance Program (NSSP).§ Querying ED visit data, initial encounter¶ unintentional and undetermined intent overdoses were identified using International Classification of Diseases, Tenth Revision, Clinical Modification (ICD-10-CM) discharge diagnosis codes for opioids,** cocaine,†† amphetamines,§§ and benzodiazepines.¶¶ Some overdoses involved more than one type of drug, and these were included in calculations for each relevant drug category; thus, categories are not mutually exclusive.*** Data are at the ED-visit level rather than the patient level; therefore, a patient with multiple overdose visits would be included multiple times in analyses.†††
The changes in rates of suspected drug overdose per 100,000 ED visits from 2018 to 2019 were calculated overall, by sex, age group, U.S. Census region of the ED facility,§§§ and county urbanization level of patient residence.¶¶¶ Because syndromic surveillance data were used to examine meaningful changes in suspected overdose-related ED visits and not to estimate numbers of persons with nonfatal drug overdoses, results reported exclude counts and rates. Relative and absolute rate changes**** were calculated from 2018 to 2019 by visit characteristics; chi-squared tests compared 2018 and 2019 rates. Absolute rate changes were included to provide context for relative changes, some of which were based on small numbers of overdoses. Changes presented represent statistically significant findings, unless otherwise specified. Percentages of suspected drug overdose ED visits†††† were calculated for specific polydrug combinations to examine the percentages of suspected cocaine-, amphetamine-, and benzodiazepine-involved overdoses that also involved opioids in 2019, overall, and for certain age groups. Chi-squared tests were used for pairwise comparisons between age groups for percentage of overdose ED visits§§§§ in 2019. For all analyses, p-values <0.05 were considered statistically significant. Analyses were conducted using SAS (version 9.4; SAS Institute).
From 2018 to 2019, overall relative and absolute rates increased for suspected nonfatal overdoses involving opioids (9.7%; 12.9 per 100,000 ED visits), cocaine (11.0%; 0.7), and amphetamines (18.3%; 1.3); rates decreased for overdoses involving benzodiazepines (−3.0%; −0.5) (Table 1). Relative and absolute rates for overdoses involving opioids increased from 2018 to 2019 among both females (7.1%; 6.0) and males (10.7%; 20.9), as well as all age groups. Cocaine- and amphetamine-involved overdose rates also increased among females (8.5%; 0.3 and 13.1%; 0.6, respectively) and males (12.4%; 1.1 and 20.5%; 2.2, respectively). Relative and absolute rate increases in amphetamine-involved overdoses occurred in all age groups except persons aged 15–24 years; relative and absolute rates of cocaine-involved overdoses increased only among persons aged 35–44 and ≥55 years. Relative and absolute rates of benzodiazepine-involved overdoses decreased among females (−4.4%; −0.7) and among persons aged 15–24 years (−7.3%; −1.7).
Among U.S. Census regions, relative and absolute increases in rates of opioid-involved overdoses were observed in the South (16.5%; 19.2), West (11.5%; 13.5), and Midwest (8.3%; 11.8); of amphetamine-involved overdoses in the Northeast (18.9%; 0.6), South (14.3%; 1.1), and West (21.2%; 3.2); and of cocaine-involved overdoses in the South (12.0%; 1.0) and Midwest (14.9%; 0.7). The Midwest experienced the only decline in relative and absolute rate for benzodiazepine-involved overdoses (−11.2%; −1.5). Relative and absolute rates of opioid-involved overdoses increased among persons living in both urban (13.6%; 16.9) and rural counties (10.1%; 6.1), as did rates of amphetamine-involved overdoses (21.7%; 1.3, urban and 20.8%; 1.9, rural).
Changes in rates of polydrug overdoses predominantly comprised those co-involving opioids and amphetamines (37.3% relative increase; 0.4 per 100,000 absolute increase) (Table 2). Relative and absolute rate increases for overdoses co-involving opioids and amphetamines were experienced by both females (32.7%; 0.2) and males (38.3%; 0.6) and all age groups except persons aged 45–54 years. Relative and absolute rate increases were identified in the Northeast (116.3%; 0.4), South (33.3%; 0.4), and West (26.7%; 0.7) Census regions. Relative and absolute increases in rates of overdoses co-involving opioids and amphetamines occurred among persons living in urban counties (54.1%; 0.5).
In 2019, opioids were involved in 40.2% of all suspected drug overdoses treated in EDs, including 28.7%, 56.9%, 49.9%, and 34.6% of overdoses among persons aged 15–24, 25–34, 35–54, and ≥55 years, respectively (Figure). In 2019, 23.6% of overdoses involving cocaine, 17.1% involving amphetamines, and 18.7% involving benzodiazepines also involved opioids. The highest percentages of cocaine- (35.0%), amphetamine- (21.1%), and benzodiazepine-involved (23.6%) overdoses that also involved opioids occurred among persons aged 25–34 years.
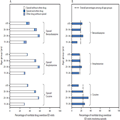
Figure.
Percentage of nonfatal emergency department (ED) visits for suspected unintentional and undetermined intent nonfatal overdoses* involving combinations of opioids† with and without cocaine,§ amphetamines,¶ or benzodiazepines** (A)†† and percentage of cocaine, amphetamine, and benzodiazepine overdoses involving opioids (B),§§ by age group — 29 states,¶¶ 2019
*Suspected unintentional and undetermined intent nonfatal overdoses identified using International Classification of Diseases, Tenth Revision, Clinical Modification (ICD-10-CM) discharge diagnosis codes.
†Nonfatal suspected unintentional and undetermined intent drug overdoses involving opioids are defined by the following ICD-10-CM discharge diagnosis codes: T40.0X1A, T40.0X4A, T40.1X1A, T40.1X4A, T40.2X1A, T40.2X4A, T40.3X1A, T40.3X4A, T40.4X1A, T40.4X4A, T40.601A, T40.604A, T40.691A, or T40.694A.
§Nonfatal suspected unintentional and undetermined intent drug overdoses involving cocaine are defined by the following ICD-10-CM discharge diagnosis codes: T40.5X1A or T40.5X4A.
¶Nonfatal suspected unintentional and undetermined intent drug overdoses involving amphetamines are defined by the following ICD-10-CM discharge diagnosis codes: T43.621A or T43.624A.
**Nonfatal suspected unintentional and undetermined intent drug overdoses involving benzodiazepines are defined by the following ICD-10-CM discharge diagnosis codes: T42.4X1A or T42.4X4A.
††For overdoses of opioids combined with other drugs, the sum of the bars for "Opioid without other drug" and for "Opioid and other drug" are the percentage totals for opioid-involved overdoses. Opioids were involved in 28.7%, 56.9%. 49.9%, and 34.6% of suspected unintentional and undetermined intent drug overdoses among persons aged 15–24, 25–34, 35–54, and ≥55 years, respectively.
§§For overdoses of cocaine, amphetamines, and benzodiazepines also involving opioid, using pairwise comparisons between age groups, statistically significant (p<0.05) differences include cocaine, persons aged 25–34 years compared with each other age group; amphetamine, persons aged 25–34 years compared with each other age group; benzodiazepines, persons aged 25–34 years compared with persons aged 15–24 and 35–54 years. Overall percentage among all age groups was 18.7% for benzodiazepine, 17.1% for amphetamine, and 23.6% for cocaine-involved overdoses also involving opioids.
¶¶Alabama, Arizona, Arkansas, Colorado, Connecticut, Delaware, Georgia, Illinois, Kansas, Kentucky, Louisiana, Maine, Maryland, Montana, Nevada, New Jersey, New Mexico, North Carolina, Ohio, Oregon, Pennsylvania, Rhode Island, South Carolina, Tennessee, Utah, Virginia, Washington, West Virginia, and Wisconsin.
Morbidity and Mortality Weekly Report. 2020;69(34):1149-1155. © 2020 Centers for Disease Control and Prevention (CDC)