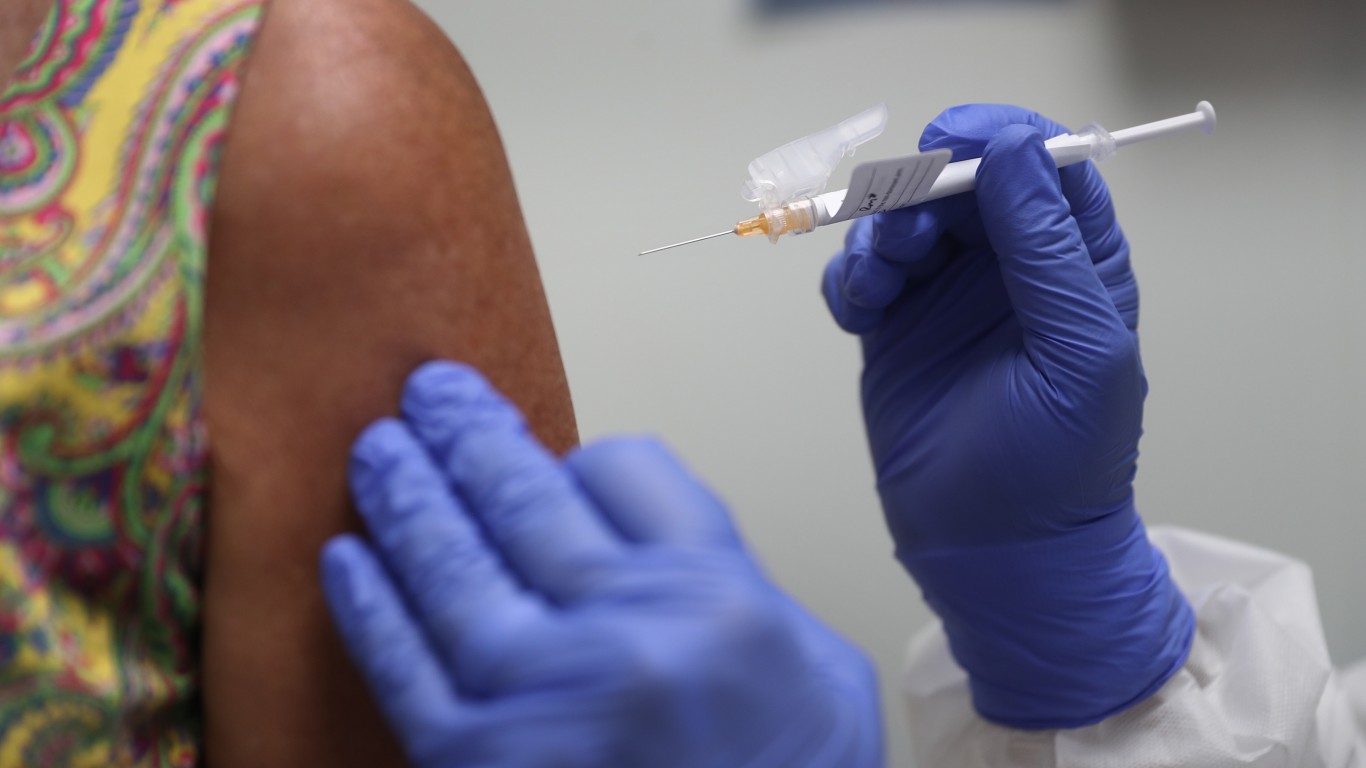

Since the first case of the omicron variant was detected in the U.S., new daily cases of COVID-19 have hit new highs. To date, 81,519,474 Americans are confirmed to have been infected with the virus — and over 1 million have died as a result. On a per capita basis, the U.S. has one of the highest known infections rates in the world.
In the New York-Newark-Jersey City metropolitan area, which covers parts of New York, New Jersey, and Pennsylvania, a total of 5,618,364 COVID-19 cases have been reported to date. Adjusted for population, there have been 28,105 reported infections for every 100,000 people in the area — above the national rate of 24,917 cases per 100,000 people.
Though per capita cases of COVID-19 are higher in New York-Newark-Jersey City than they are nationwide, there are still parts of the metro area where the per capita infection rate is relatively low.
The broader New York metro area comprises 25 counties or county equivalents — and of them, Pike County in Pennsylvania has the fewest COVID-19 cases per capita. So far, there have been a total of 10,557 confirmed infections in Pike County, or 19,022 for every 100,000 people.
Not only does Pike County have the lowest per capita infection rate in the New York metro area, it also has a relatively low per capita fatality rate.
There have been a total of 177 coronavirus-related deaths for every 100,000 people in Pike County, below the 400 COVID-19 deaths per 100,000 across the entire New York-Newark-Jersey City metro area.
All COVID-19 data used in this story are current as of May 16, 2022.
| Rank | Geography | COVID cases per 100,000 people | Total cases | Deaths per 100,000 people | Total deaths |
|---|---|---|---|---|---|
| 1 | Pike County, PA | 19,022 | 10,557 | 177 | 98 |
| 2 | Hunterdon County, NJ | 20,717 | 25,907 | 220 | 275 |
| 3 | Somerset County, NJ | 21,836 | 72,097 | 295 | 975 |
| 4 | Dutchess County, NY | 22,784 | 66,962 | 224 | 659 |
| 5 | Middlesex County, NJ | 24,640 | 203,696 | 348 | 2,877 |
| 6 | Sussex County, NJ | 24,875 | 35,397 | 335 | 476 |
| 7 | Putnam County, NY | 25,109 | 24,875 | 126 | 125 |
| 8 | Morris County, NJ | 25,396 | 125,555 | 313 | 1,549 |
| 9 | Bergen County, NJ | 25,637 | 238,428 | 372 | 3,455 |
| 10 | Hudson County, NJ | 26,720 | 178,658 | 407 | 2,721 |
| 11 | Union County, NJ | 27,228 | 150,590 | 426 | 2,355 |
| 12 | New York County, NY | 27,249 | 444,837 | 335 | 5,463 |
| 13 | Westchester County, NY | 27,296 | 264,448 | 281 | 2,720 |
| 14 | Monmouth County, NJ | 27,561 | 171,810 | 350 | 2,180 |
| 15 | Essex County, NJ | 27,973 | 221,984 | 455 | 3,612 |
| 16 | Kings County, NY | 27,989 | 727,930 | 494 | 12,845 |
| 17 | Ocean County, NJ | 28,368 | 167,923 | 503 | 2,975 |
| 18 | Bronx County, NY | 29,013 | 417,169 | 539 | 7,745 |
| 19 | Queens County, NY | 29,036 | 667,393 | 517 | 11,877 |
| 20 | Passaic County, NJ | 29,647 | 149,431 | 464 | 2,337 |
| 21 | Rockland County, NY | 29,702 | 96,142 | 277 | 897 |
| 22 | Suffolk County, NY | 29,894 | 444,799 | 296 | 4,397 |
| 23 | Orange County, NY | 30,143 | 114,009 | 305 | 1,155 |
| 24 | Nassau County, NY | 31,358 | 425,386 | 284 | 3,852 |
| 25 | Richmond County, NY | 36,360 | 172,381 | 491 | 2,330 |
Take This Retirement Quiz To Get Matched With An Advisor Now (Sponsored)
Are you ready for retirement? Planning for retirement can be overwhelming, that’s why it could be a good idea to speak to a fiduciary financial advisor about your goals today.
Start by taking this retirement quiz right here from SmartAsset that will match you with up to 3 financial advisors that serve your area and beyond in 5 minutes. Smart Asset is now matching over 50,000 people a month.
Click here now to get started.
Thank you for reading! Have some feedback for us?
Contact the 24/7 Wall St. editorial team.


