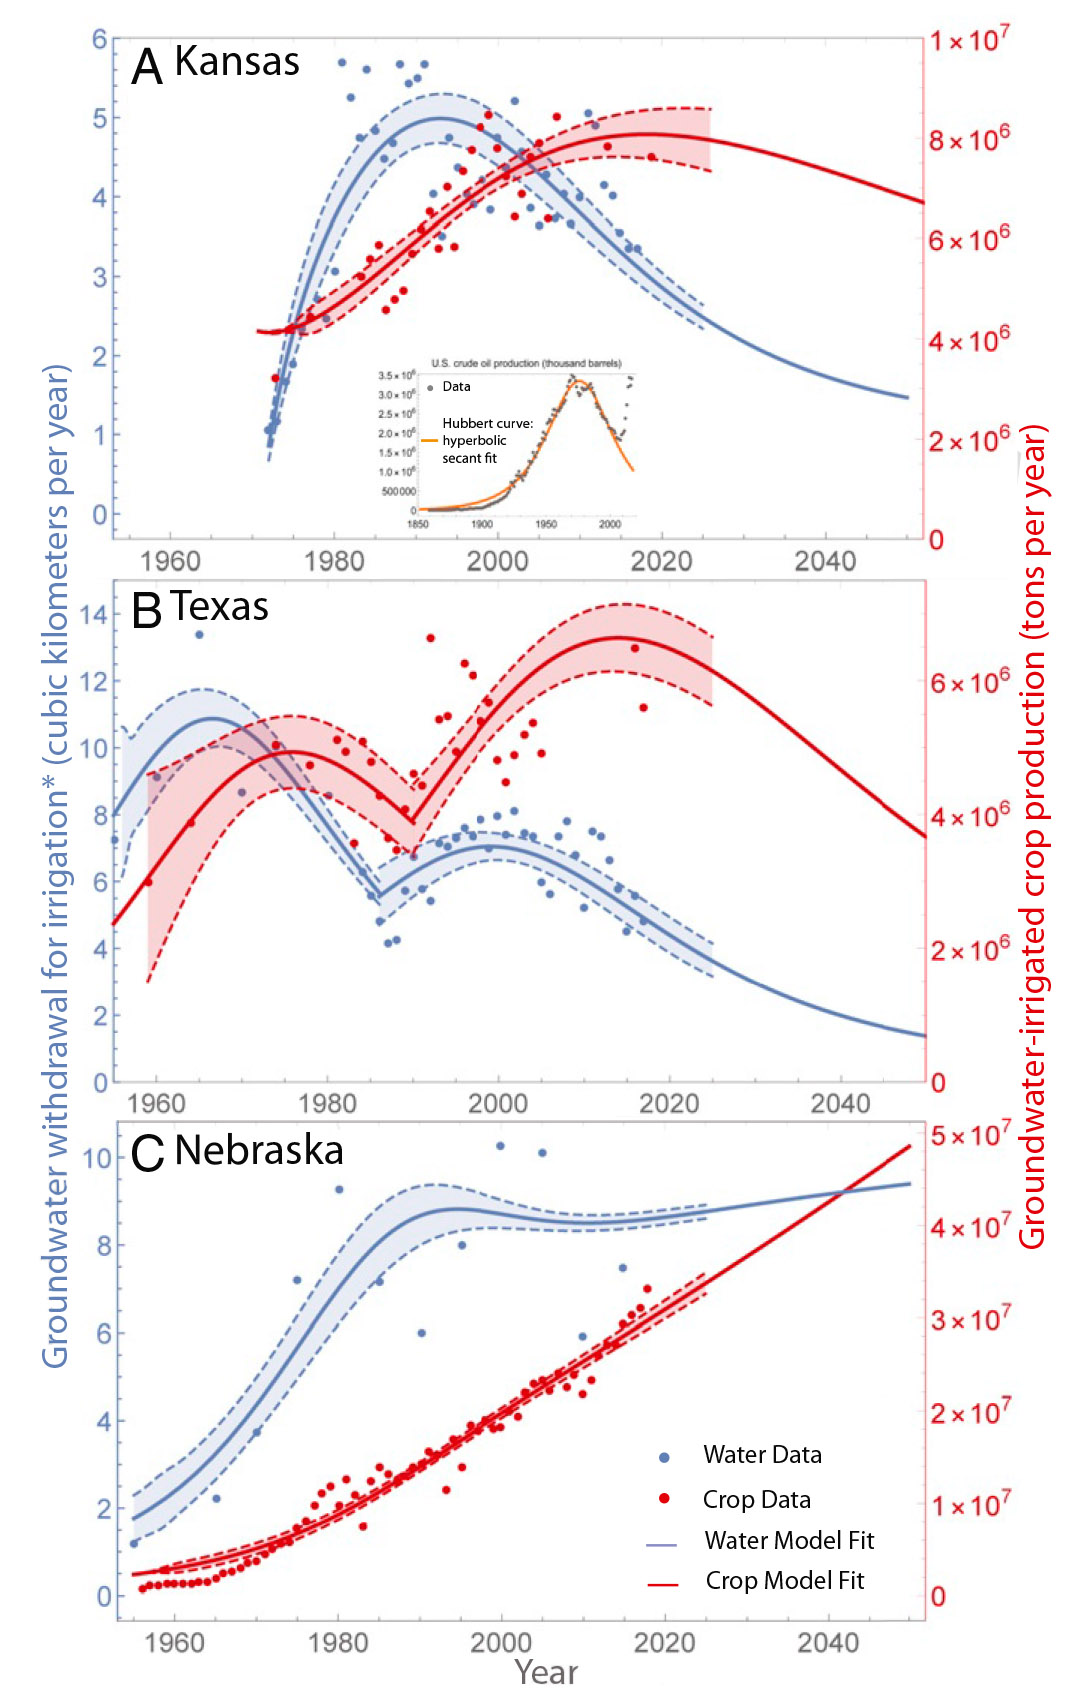
“Peak oil” is a familiar phrase that refers to the point when oil production ceases its steady upward climb and begins to decline. It has its roots in a mathematical curve proposed by geologist M. King Hubbert in the 1950s, which he applied to total US production.
That same curve has been used to describe the depletion of groundwater in regions where water is replenished much too slowly for heavy use to be sustainable. In the United States, that famously includes the Ogallala Aquifer beneath the croplands of the High Plains region.
Hubbert’s curve is fairly simple, rising and falling symmetrically on either side of the peak. More specific forecasts of “peak water” require a bit more sophistication. To capture that complexity while keeping things simple enough to easily generate a big-picture view, a new study led by Assaad Mrad at Duke University actually used some math that's similar to another familiar relationship: the predator-prey interactions of the food chain.
Preying on water
Just as predators and prey each respond to changes in the other, the mathematical model here allows for feedbacks between the costs of chasing a shrinking resource and the profits of agricultural output through irrigation. Set up to represent Texas, Kansas, and Nebraska, the model tracks the area and volume of groundwater aquifers, the amount of rainfall that infiltrates to recharge them, and the irrigation techniques that turn water into crop yields.
In the model, potential gains in crop yields can drive expansion of wells and pumping, but the energy costs of pumping from deeper depths can also drive investment in more efficient irrigation. Overall, the model produces two curves: one for groundwater use over time and the other for total crop production over time. Both can peak and decline.
Let’s take Kansas first. The model curve represents increasing groundwater use as irrigated cropland area rose through the 1970s and peaked in the 1990s. The model now forecasts declining groundwater use over the coming decades.
It also forecasts that crop production has peaked in the last few years. Part of the continuing growth in production is attributable to trends in the type of crop, the researchers say. Winter wheat and sorghum yield less per acre than corn does, and corn’s share of irrigated cropland has grown over time. That helped delay the peak a bit, but it peaked nonetheless.
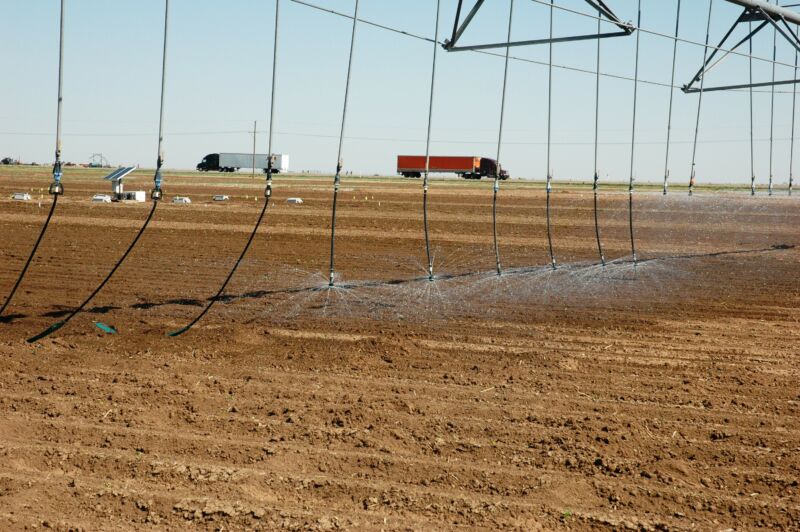
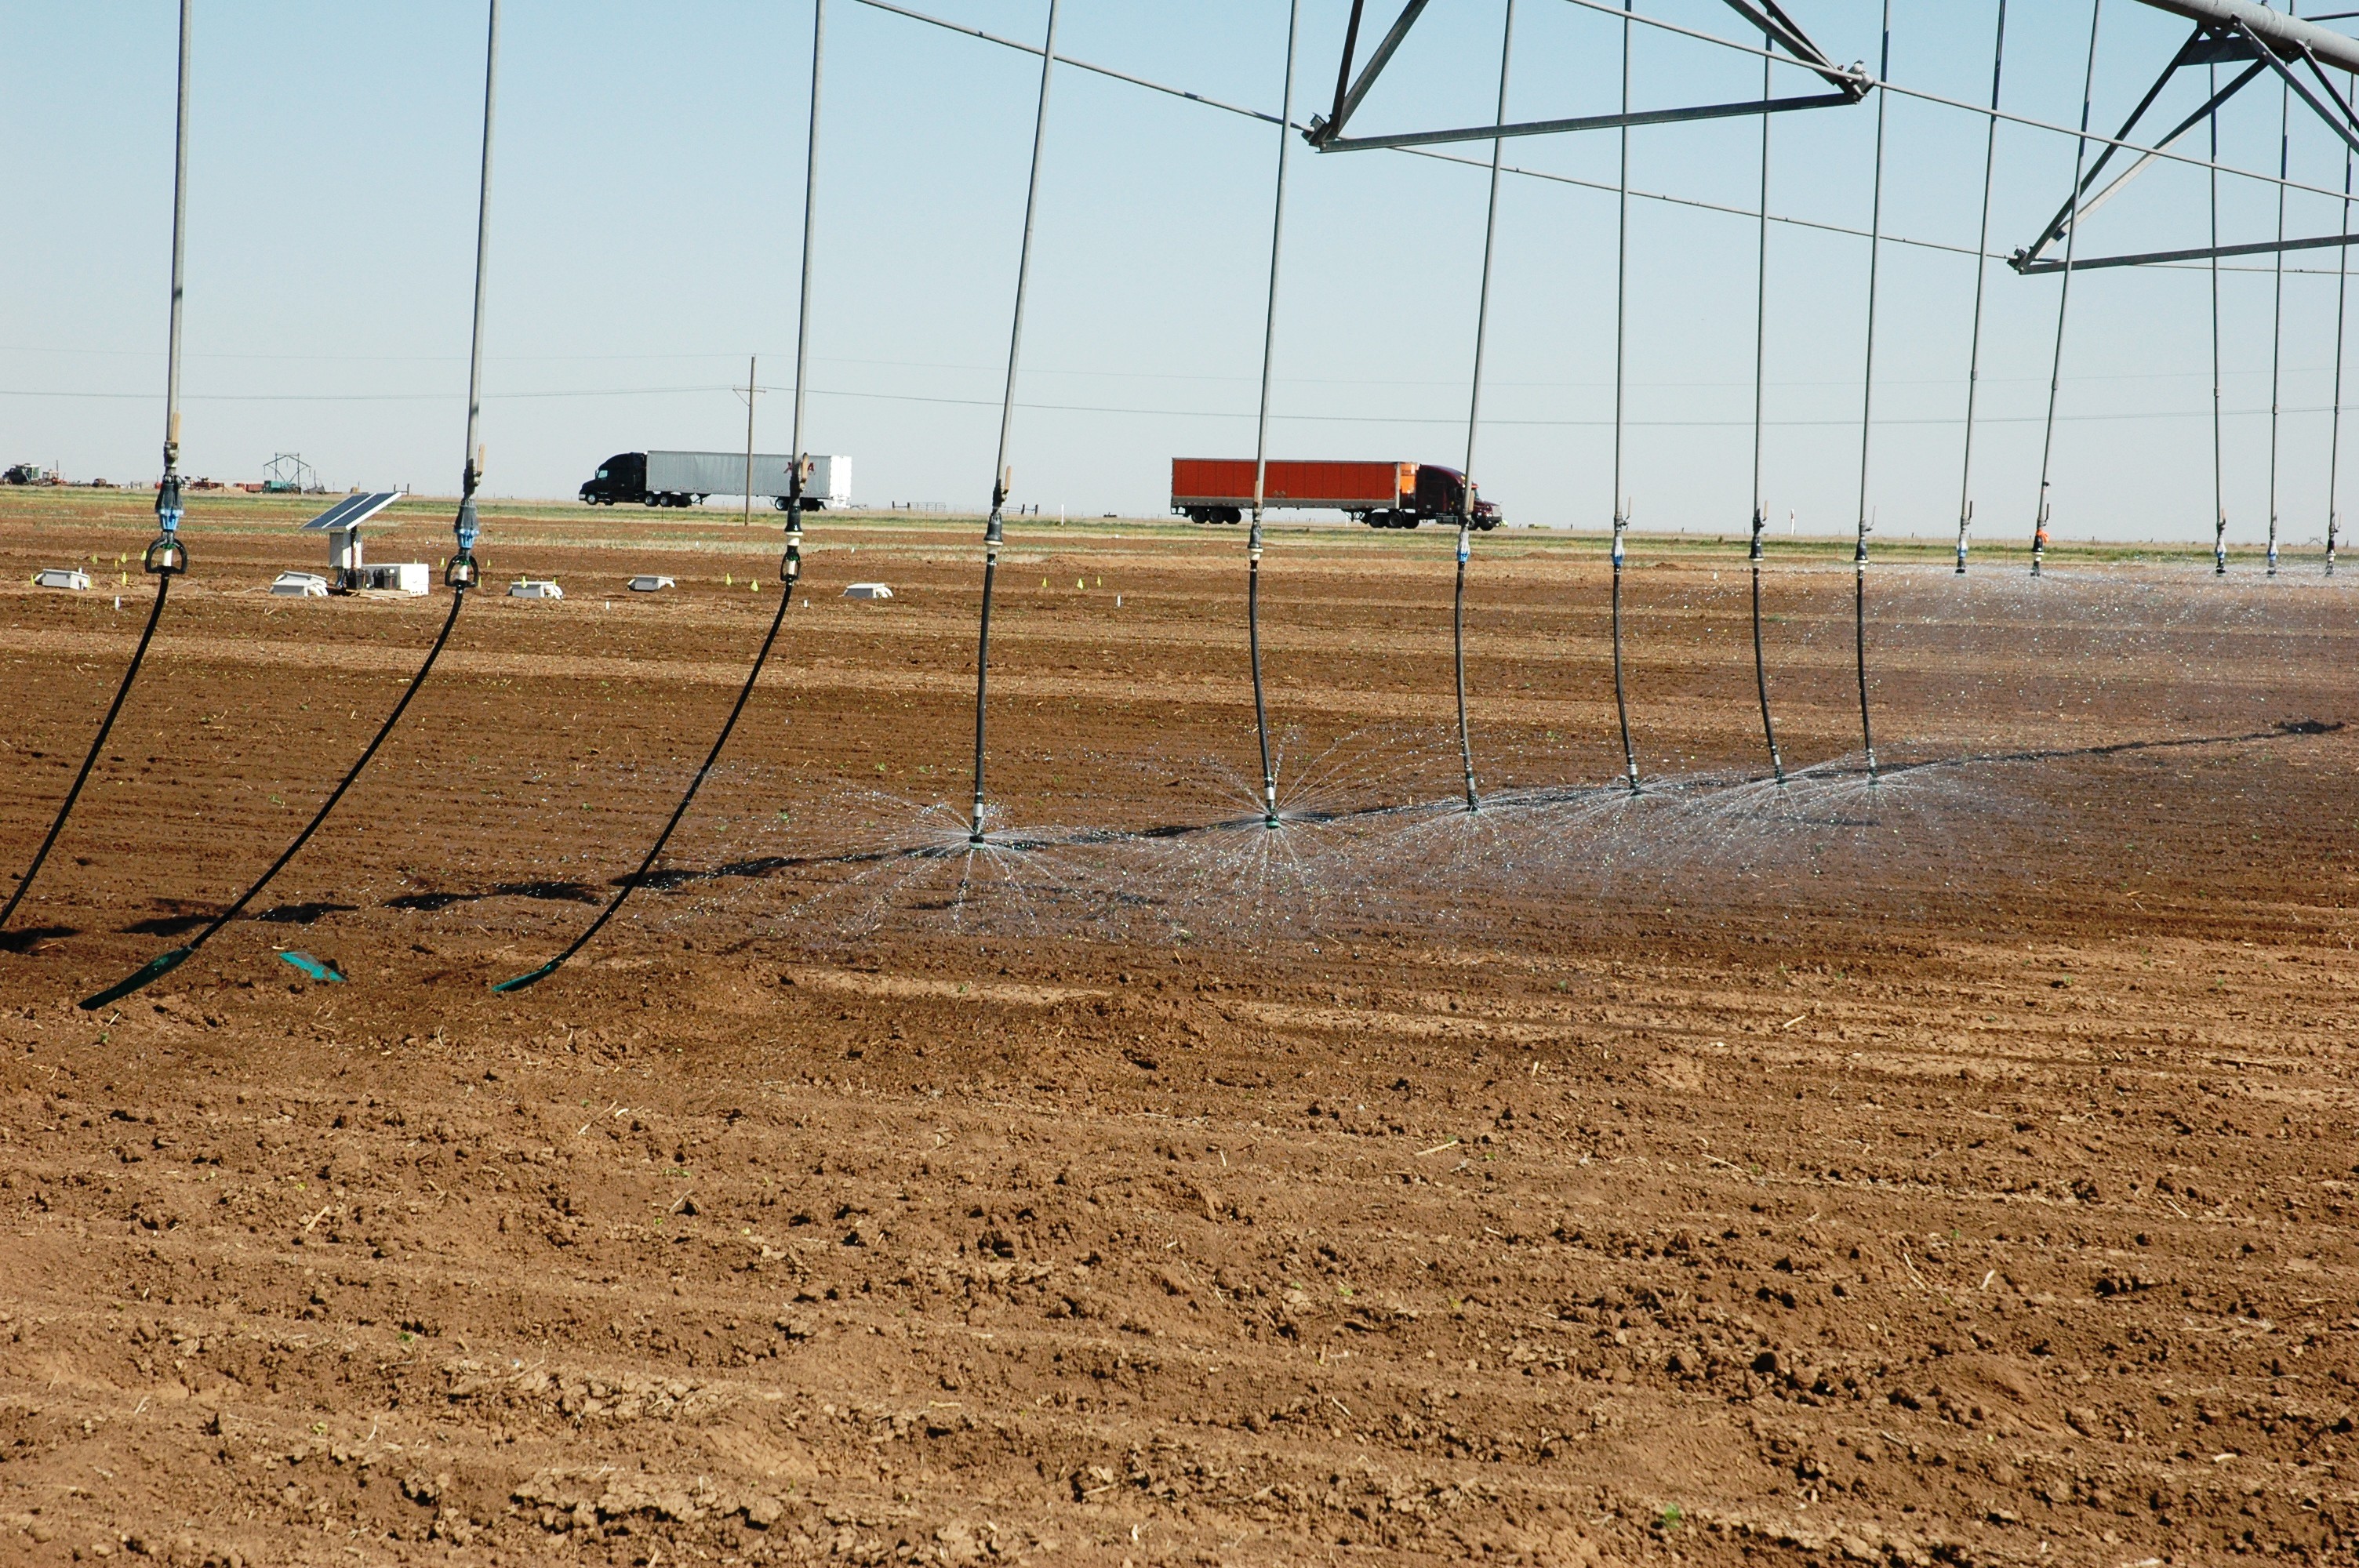
In Texas, the analysis gets more complicated. Groundwater use peaked in 1966, the researchers say, with peak crop production arriving in 1975. But around the 1980s, both started to rise again. That’s due to the adoption of much more efficient irrigation—what’s known as Low Energy Precision Application techniques. This involves sprinkler heads that hang down nearly to ground level, with furrows in the soil to catch water and keep it from moving far.
With more “grain per gallon,” increased water use became profitable for a while until depletion and energy costs caught up again. A second, lower peak in groundwater use occurred around 1997, while the model sees a higher second peak in grain production around 2012.
Water in, water out
Nebraska, by contrast, actually has a relatively steady outlook. Nebraska has the best groundwater resource of these states, both in terms of volume of water and the rate at which it replenishes. That’s not due to rainfall, as these states are actually similar in that regard, although warmer temperatures in Texas can drive more evaporation. Instead, the researchers say, Nebraska’s sandier soils allow more rain to infiltrate into the ground and recharge the aquifer.
As a result of combining this advantage with the use of efficient irrigation, Nebraska’s groundwater use reached stable plateau around the year 2000. Because of that stability, the model projection allows grain production to increase through to the end in 2050.
One takeaway here is obvious: the future of irrigated agriculture in Nebraska looks much healthier than in Kansas or Texas. It’s certainly possible for another technological advance to come along and improve things, as the sudden uptake of more efficient irrigation in Texas showed. But reversing these trends is unlikely. A plausible but large future efficiency gain in Texas could cause a third grain peak, the researchers say, but it would fall short of the second peak.
As for the Hubbert curve, the researchers point out that the closer you are to sustainable water use, the less Hubbert-like things look. Texas was so far from equilibrium that the curves come out pretty symmetrical (double hump notwithstanding). But when the ledger is a little less dire, the trends on either side of the peak can be markedly different, necessitating a different mathematical approach.
The researchers argue that their particular approach is useful and applicable to other regions facing the same problems. But on the simplest level, this just expands on a reality that's well-known to anyone with a bank account: you cannot keep taking out more than goes in.
PNAS, 2020. DOI: 10.1073/pnas.2008383117 (About DOIs).
reader comments
97