![]() Matt Simpson, CFTe, MSTA
Matt Simpson, CFTe, MSTA
CityIndex
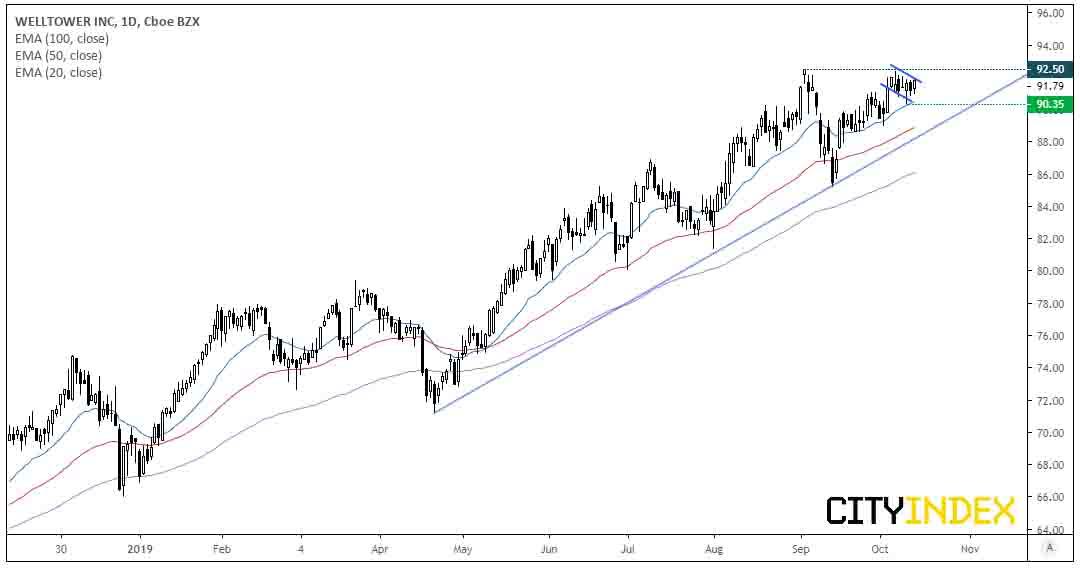
Welltower Inc CFD/DFT: The stock remains in a strong uptrend and is now consolidating just beneath record highs. The 20-day eMA is holding as support and we’re now watching to see it can break out of compression to new highs. Given it trend is so strong yet has also had time to consolidate this could be of interest to momentum traders on the daily and intraday timeframes.
-
A break above 92.50 assumes bullish trend continuation. Ideally a break will be seen on higher volume, or traders could wait to see if we see a daily close, or 82.50 is respected as support before committing.
-
An open target could be used as a breakout would be new record highs.
-
A break below 90.35 signals mean reversion, although the bullish trendline is also nearby to provide potential support.
-
A break of the trendline could be taken as a sign a deeper correction could be underway.
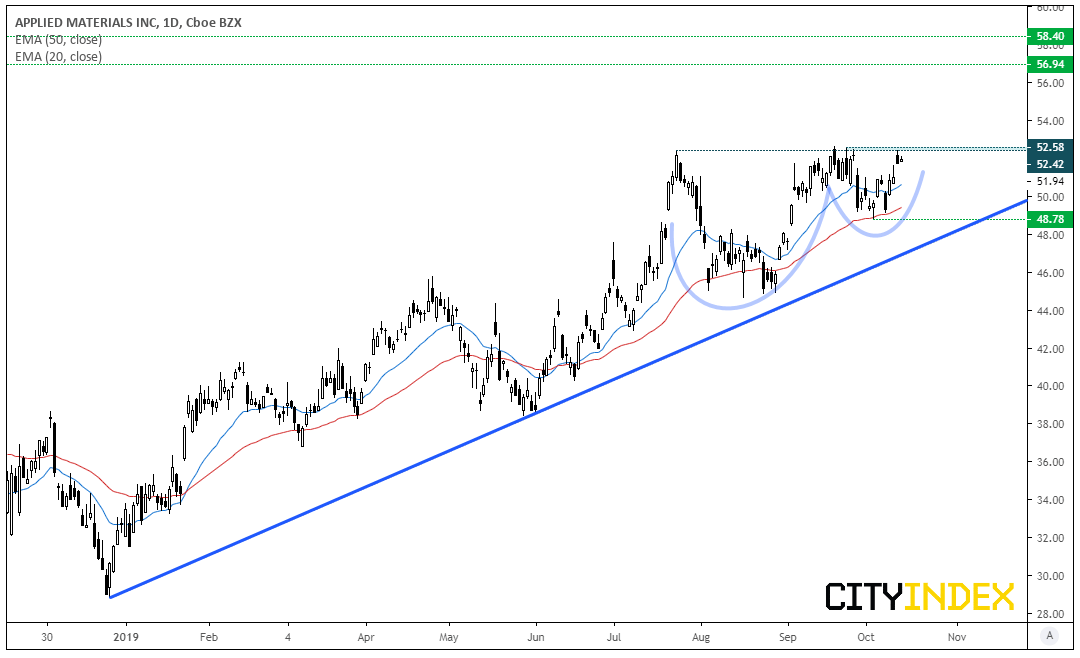
Applied Materials CFD/DFT: The bullish trend is less established than Welltower’s, yet a cup and handle continuation pattern has caught our eye. Prices have found resistance just below 52.60 and the two recent higher lows are what form the cup and handle components. Moreover, the 50-day eMA acted as support ahead of the latest leg higher. Of course, it’s possible resistance could hold for a while long, in which case look for the pattern to morph into a continuation pattern such as an ascending triangle. But ultimately, we’re looking for a breakout above resistance.
-
A break above 52.60 assumes bullish trend continuation. If it breaks higher without a retracement prior, then it confirms the cup and handle pattern.
-
The bias remains bullish above 48.78. If we see a pullback from the highs, we’d seek a higher low above 48.78 to show bullish pressure continues to build.
-
Whilst the pattern projects an initial target around 60, swing highs around 56.94 and 58.40 make viable interim targets.
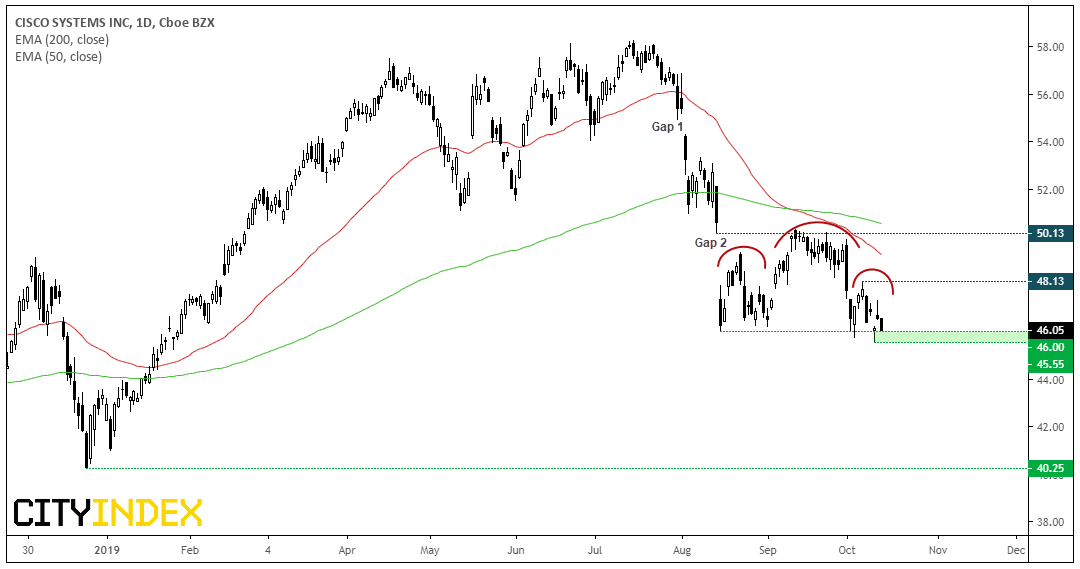
Cisco Systems CFD/DFT: It’s far from perfect as we’re unable to draw an ideal neckline, yet the formation screams head and shoulders top. As the trend is clearly bearish, the H&S is now a continuation pattern which could target the 41-42 area if successful.
The fact we’ve seen two notable gaps lower since the post-Nasdaq bubble highs suggests the downtrend could still be within its infancy. And we especially like how the ‘head’ has closed the gap before turning lower, with the 200 and 50-day eMA’s capping as resistance and providing a death cross (a dramatic name for the faster average closing beneath the longer one).
-
The near-term bias remains bearish whilst prices hold below 48.13
-
A break below 46 assumes bearish trend continuation
-
With the H&S targeting the 41-42 area, traders can use round numbers as interim targets, or simply keep an open target towards the 40.25 low
Price Action Update: It's A Fine Line Between Bullish & Bearish on S&P500 | Apple, Netflix
Apple Inc CFD/DFT: After breaking out of its small correction line, prices reversed yet found support at the lower channel before accelerating high. Going on to close to fresh record highs on Friday, a small bearish hammer has formed to warn of near-term exhaustion. Still, as the trend remains bullish we’ll continue to seek opportunities to buy dips after prices have had a chance to consolidate or correct.
Netflix CFD/DFT: Prices have rebounded a little further than we’d hoped and now closed above the 275.80-282.66 resistance zone. However, the trend structure remains bearish and yesterday’s bearish hammer remains below the 50-day eMA. With earnings due for release tomorrow, we’re keen to see if it can roll over once more in line with the bearish bias or threaten the trend with a break above 305.
CFD and forex trading are leveraged products and can result in losses that exceed your deposits. They may not be suitable for everyone. Ensure you fully understand the risks. From time to time, City Index Limited’s (“we”, “our”) website may contain links to other sites and/or resources provided by third parties. These links and/or resources are provided for your information only and we have no control over the contents of those materials, and in no way endorse their content. Any analysis, opinion, commentary or research-based material on our website is for information and educational purposes only and is not, in any circumstances, intended to be an offer, recommendation or solicitation to buy or sell. You should always seek independent advice as to your suitability to speculate in any related markets and your ability to assume the associated risks, if you are at all unsure. No representation or warranty is made, express or implied, that the materials on our website are complete or accurate. We are not under any obligation to update any such material. As such, we (and/or our associated companies) will not be responsible or liable for any loss or damage incurred by you or any third party arising out of, or in connection with, any use of the information on our website (other than with regards to any duty or liability that we are unable to limit or exclude by law or under the applicable regulatory system) and any such liability is hereby expressly disclaimed
Recommended Content
Editors’ Picks
AUD/USD remained bid above 0.6500

AUD/USD extended further its bullish performance, advancing for the fourth session in a row on Thursday, although a sustainable breakout of the key 200-day SMA at 0.6526 still remain elusive.
EUR/USD faces a minor resistance near at 1.0750

EUR/USD quickly left behind Wednesday’s small downtick and resumed its uptrend north of 1.0700 the figure, always on the back of the persistent sell-off in the US Dollar ahead of key PCE data on Friday.
Gold holds around $2,330 after dismal US data

Gold fell below $2,320 in the early American session as US yields shot higher after the data showed a significant increase in the US GDP price deflator in Q1. With safe-haven flows dominating the markets, however, XAU/USD reversed its direction and rose above $2,340.
Bitcoin price continues to get rejected from $65K resistance as SEC delays decision on spot BTC ETF options

Bitcoin (BTC) price has markets in disarray, provoking a broader market crash as it slumped to the $62,000 range on Thursday. Meanwhile, reverberations from spot BTC exchange-traded funds (ETFs) continue to influence the market.
US economy: slower growth with stronger inflation

The dollar strengthened, and stocks fell after statistical data from the US. The focus was on the preliminary estimate of GDP for the first quarter. Annualised quarterly growth came in at just 1.6%, down from the 2.5% and 3.4% previously forecast.