
The coronavirus loves a crowd. Put enough warm, susceptible bodies together and it's sure to spread. Scientists have known that since nearly the start of the pandemic, from studying COVID-19 outbreaks aboard the Diamond Princess cruise ship, inside a megachurch in South Korea, at a Champions League soccer match in Italy. Countless other clusters have since been recorded, often seeded by a single contagious individual.
It’s the danger of crowds that led the governments of other countries to enact national lockdowns. In the United States, it was more of a patchwork of state and local stay-at-home orders, school closures, and bans on mass gatherings. As scientists have learned more about the specific conditions that can lead to such superspreading events—unmasked people talking, singing, or exercising inside poorly ventilated indoor spaces—that’s made it possible, in theory, to fine-tune these disease-containment strategies and to ease up on the most dramatic restrictions and focus on the policies that do the most to stem the spread of the virus.
But people also love a crowd. And over the late spring and summer, a number of mass gatherings—often anxiously watched by the media, health care professionals, and worried neighbors—became real-life experiments in what happens when you put people together in the COVID-19 era. The events ranged from the apolitical (spring break, summer camp, back-to-school) to the politically supercharged (President Trump’s Tulsa rally, “reopen” protests, anti-police brutality protests, and ongoing demonstrations in Portland against the use of federal agents). Each one tested different variables—masks versus no masks, indoors versus outdoors—but all elicited an opportunity to study the same questions: How many people would get sick as a result, how many would die, and who would bear the cost of the health care bill?
![]()
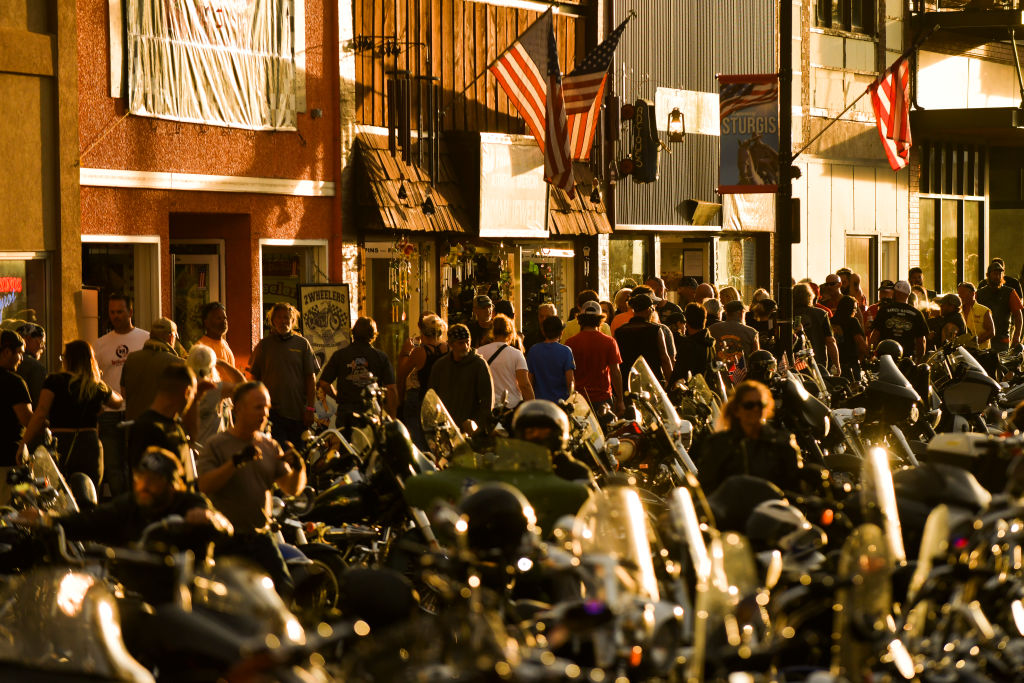
That’s why studies like the one released this week measuring the effect of the Sturgis, South Dakota, motorcycle rally on COVID-19 transmissions led to such a confirmation-bias-feeding social media sharing frenzy. In a non-peer-reviewed working paper, four researchers affiliated with the Center for Health Economics & Policy Studies at San Diego State University analyzed anonymized cell phone data gathered across the US throughout the summer to see from where in America Sturgis drew its nearly 500,000 attendees. Then they tracked what happened to COVID-19 case rates in counties with high numbers of rally-goers in the weeks following the August event. They compared these so-called high in-flow areas to demographically matched “synthetic” counties.
To clarify, the synthetic counties are real; they’re places in the US with similar characteristics—population structure, COVID-19 transmission rates and trends, and disease mitigation policies—to the high in-flow ones. The only thing different about them, the researchers’ model assumes, is that a bunch of the residents in these counties didn’t spend a week partying in the South Dakota hills. That’s what makes them a control.
“We can’t observe what would have happened if the event hadn’t occurred,” says Joseph Sabia, one of the report’s four coauthors. “So we construct our best estimate of what that alternative universe looks like.”
The researchers took that delta—the difference in case rates between each county and its control—and multiplied it by the total cases each county had accumulated before the rally. Then they added all of those up. In other words, it was a lot of math. Not surprising, given it was an economic study, not an epidemiological investigation. But it’s still important to note that the authors didn’t use methods like contact tracing or genetic analysis of viral strains to determine where people in various counties had actually become infected, and if indeed they were all carrying the same viral strain (or strains), which you’d expect of people who’d all been exposed at a single event.
Reader Comments (59)
View comments on forumLoading comments...