Results
Cell-based Screening for Inhibitors of Hyperglycemia-induced Mitochondrial ROS Production in Endothelial Cells
To induce enhanced mitochondrial ROS production in endothelial cells, we exposed bEnd.3 murine microvascular endothelial cells to hyperglycemia for various time periods. Extended hyperglycemic exposure progressively increased the mitochondrial ROS generation after 10–14 days (Fig. 1A–D). The enhanced ROS production was not associated with marked alterations in the expression level of genes related to the mitochondrial respiration and ATP production (Fig. 1E, Supplementary Tables 1 and 2).

Figure 1.
Long-term hyperglycemia induces mitochondrial oxidant production in endothelial cells. A–D: bEnd.3 cells were exposed to hyperglycemia (high) or maintained in 5 mmol/L glucose (low) containing medium for 10 days or for the indicated time period, then the cells were loaded with superoxide sensor MitoSOX Red and Hoechst 33342. The oxidation of MitoSOX was recorded on kinetic reader; the maximum reaction rates (Vmax) (A) and typical kinetic curves are shown (B). Micrographs of cells maintained in normoglycemic (C) or hyperglycemic (D) medium were taken 2 h after the superoxide sensor loading. E: Gene expression changes in bEnd.3 cells exposed to hyperglycemia for 7 days were analyzed with mitochondrial energy array. The gene symbols and relative expression (fold change) in hyperglycemic cells are shown compared with normoglycemic cells (*P < 0.05).
By measuring the oxidation of MitoSOX in cultured bEnd.3 endothelial cells, we conducted cell-based screening to identify compounds that inhibit the mitochondrial ROS production induced by elevated extracellular glucose. We have tested a focused library consisting of 6,766 compounds, which included clinical stage drugs, biologically active compounds with defined pharmacological activity, and natural compounds (compound libraries tested in the primary screen are listed in Table 1). Compound exposure (3 μmol/L) started on day 7 of the experiment. The measurement of mitochondrial ROS production was combined with cell viability measurements, performed in the same wells (Fig. 2).

Figure 2.
Cell-based screening for compounds that decrease the mitochondrial ROS production in endothelial cells. A: Timeline of the cell-based screening: bEnd.3 cells were exposed to hyperglycemia for 10 days with 3-day-long compound treatment (3 μmol/L). Mitochondrial ROS production was measured with the superoxide MitoSOX Red with simultaneous assessment of viability. B: Dot graph showing the individual ROS/viability results of the tested 6,766 compounds. Oxidant production data are shown as ROS score (1 ROS score = 25% decrease in ROS production compared with hyperglycemic average value) and viability values are plotted as percent values. The yellow area denotes the compounds that decreased the ROS production without marked reduction of cellular viability. Distribution of viability (C) and ROS (D) data (SD of viability = 24.69%, SD of ROS score = 0.717, or SD of ROS production = 17.93%).
Both cellular ROS production and cell viability showed a Gaussian distribution, and the majority of the compounds did not affect mitochondrial ROS generation. Detailed results of the primary screen are shown (Supplementary Table 5). Compounds that decreased mitochondrial ROS production (ROS score >1) were in two categories: they either decreased the viability (viability score <−1) or did not affect it. Cytotoxic compounds (i.e., compounds that simultaneously decreased ROS production and cell viability) were excluded from further analysis. The nontoxic compounds that inhibited hyperglycemia-induced ROS production at 3 μmol/L by >25% in the primary screen were retested in replicates at 10 μmol/L using the same assay. Results of the hit confirmation assay are summarized (Supplementary Table 3). Compounds whose activity on ROS production was confirmed in the secondary assay are listed in the Table 1. Hit molecules included steroids, nonsteroidal anti-inflammatory agents, microtubular agents, mitochondrial uncouplers, and antimetabolites. Statins, which previously have been shown to suppress hyperglycemic ROS production in endothelial cells,[11,12] also inhibited ROS production in our experimental conditions; however, these effects also were associated with a suppression of cellular viability (Supplementary Fig. 1).
From the multiple classes of pharmacologically active compounds identified from the screen, we have focused our subsequent studies on the clinically used antidepressant compound paroxetine. This compound (both its hydrochloride and maleate salts, as present in different libraries) consistently reduced the mitochondrial ROS production in the screens and showed preference to inhibit mitochondrial ROS production, as opposed to total cellular ROS generation (as measured by the DCFDA assay) (Fig. 3). Paroxetine remained effective against the hyperglycemia-induced mitochondrial ROS generation in human endothelial cells (Fig. 3). The effect of paroxetine involves an immediate mode of action, because it remained effective in shorter treatment schedules (Fig. 3) and did not affect the expression of any of the mitochondrial genes studied during hyperglycemia (Supplementary Fig. 2, Supplementary Table 4).

Figure 3.
Paroxetine inhibits the mitochondrial oxidant production in endothelial cells. bEnd.3 murine (top panels) and EA.hy926 human endothelial cells (bottom panels) were exposed to hyperglycemia for 10 days with 3-day-long (chronic) paroxetine treatment at the indicated concentration or immediately before the ROS measurement (acute). Mitochondrial ROS, viability, and cytoplasmic ROS production were measured with MitoSOX Red, Hoechst 33342, and CM-H2DCFDA (DCFDA), respectively, and are expressed as percent values compared with normoglycemic control cells (low). #P < 0.05 compared with normoglycemic control; *P < 0.05 compared with hyperglycemic cells.
Paroxetine Acts as a Mitochondrial Superoxide Scavenger
To test whether the paroxetine-mediated decrease in hyperglycemic ROS production is a result of inhibition of the mitochondrial respiration and oxidative phosphorylation, we have characterized the metabolic profile of bEnd.3 cells exposed to hyperglycemia in the presence or absence of paroxetine using extracellular flux analysis. Elevated extracellular glucose increased the cellular oxygen consumption (an indicator of aerobic metabolism) with no change in the degree of acid production (Fig. 4). Elevated glucose caused an increase in the mitochondrial potential (total respiratory capacity, measured in response to the uncoupling agent FCCP) in the absence of any detectable anaerobic compensation (Fig. 4B). Paroxetine did not affect the cellular ATP content or oxygen consumption (Fig. 4D), whereas it decreased mitochondrial superoxide generation (Fig. 4E).

Figure 4.
The paroxetine-mediated mitochondrial antioxidant effect is not associated with perturbed cellular respiration. bEnd.3 cells were exposed to hyperglycemia (high) with or without paroxetine (PRX; 3 μmol/L for 3 days) treatment, and control cells were maintained in medium containing 5 mmol/L glucose (low). A–C: Cellular metabolism was measured with the Seahorse metabolic analyzer. ATP-production linked OCR (A) and ECAR (B) were measured, followed by determination of the non-ATP-linked oxygen consumption (proton leak), maximal respiration capacity, and the nonmitochondrial oxygen consumption by adding oligomycin, FCCP, and antimycin A, respectively. The ATP production linked (basal) OCR values (C) and cellular ATP levels (D) are shown (*P < 0.05). E: Representative micrographs of b.END3 cells treated with paroxetine (PRX; 3 μmol/L) and loaded with MitoSOX Red. F: ROS production of isolated mitochondria was measured by the superoxide sensor MitoSOX Red in the presence of paroxetine at the indicated concentrations. Superoxide was generated by xanthine oxidase and detected by nitroblue tetrazolium (NBT) (G) or MitoSOX Red (H) in the presence of paroxetine at the indicated concentrations. *P < 0.05 compared with vehicle.
Because the action of paroxetine was rapid-onset and did not involve changes in gene expression, we next tested the activity of paroxetine on ROS production in isolated mitochondria. Paroxetine significantly reduced the detectable superoxide generation in the low micromolar range in isolated mitochondria (Fig. 4F), without affecting oxygen consumption rate (Supplementary Fig. 3). Next, we generated superoxide using the enzyme xanthine oxidase to test whether paroxetine directly interacts with superoxide. We used MitoSOX Red or nitroblue tetrazolium to measure the superoxide generation. Paroxetine reduced the superoxide signal in a dose-dependent manner in these cell-free systems (Fig. 4G, H).
Paroxetine is reported to decompose under certain conditions to trans-4-(4'-fluorophenyl)3-hydroxymethyl)-piperidine, which involves the cleavage of the sesamol part.[9] Both trans-4-(4'-fluorophenyl)3-hydroxymethyl)-piperidine and sesamol decreased the mitochondrial ROS production by themselves, but sesamol was more potent than the piperidine compound. Sesamol significantly decreased the hyperglycemia-induced mitochondrial ROS generation at 1 μmol/L, and the combination of trans-4-(4'-fluorophenyl)3-hydroxymethyl)-piperidine potentiated the antioxidant activity of sesamol (Fig. 5A–D). Further decomposition of paroxetine can be attained by photolysis that includes the cyclization of the piperidine compound. We degraded paroxetine in aqueous solution by ultraviolet irradiation and found that the partially degraded paroxetine retained its activity to a certain extent, but the end products of the complete photolysis no longer showed an inhibitory effect on ROS production (Supplementary Fig. 4).

Figure 5.
The mitochondrial antioxidant property of paroxetine-related compounds. bEnd.3 cells were exposed to hyperglycemia (high) for 10 days and loaded with MitoSOX Red. A–C: Paroxetine building blocks sesamol, trans-4-(4'-fluorophenyl)3-hydroxymethyl)-piperidine or their combination was added to the cells at the indicated concentrations immediately before the ROS measurement. D: Structure of paroxetine, trans-4-(4'-fluorophenyl)3-hydroxymethyl)-piperidine and sesamol. The indicated serotonin or norepinephrine reuptake inhibitors were added to the cells 3 h before MitoSOX loading at 10 μmol/L (E) or immediately before (F) the ROS measurement at 1 μmol/L. Mitochondrial ROS production is shown as Vmax value of MitoSOX oxidation. #P < 0.05 compared with normoglycemic cells (low); *P < 0.05 compared with hyperglycemic cells. (A high-quality color representation of this figure is available in the online issue.)
To further elucidate whether the inhibitory function of paroxetine on the mitochondrial ROS generation depends on its antioxidant properties, we compared the effect of several serotonin reuptake inhibitors and substructures of paroxetine on hyperglycemic mitochondrial ROS production in bEnd.3 cells. None of the other serotonin reuptake inhibitor compounds (or norepinephrine reuptake inhibitors) tested affected the mitochondrial ROS production either in pretreatment or when acutely added to the cells (Fig. 5E, F).
Paroxetine Prevents the Hyperglycemia-induced Oxidative Damage in Vitro
To test whether paroxetine exerts cytoprotective effects during hyperglycemia, we next determined the oxidative damage at DNA, RNA, and protein levels. The bEnd.3 cells were exposed to hyperglycemia with paroxetine treatment (10 μmol/L for days 7–10 of the experiment). Hyperglycemia-mediated DNA fragmentation, measured by the Comet assay, was attenuated by paroxetine, indicative of the ability of paroxetine to attenuate the downstream consequences of mitochondrial ROS production (Fig. 6A, C). The formation of 8-hydroxy-guanosine (an indicator of oxidative damage to the RNA) also was detected in hyperglycemic cells, and it was reduced by paroxetine (Fig. 6B). The relative amount of (amplifiable) mitochondrial DNA was decreased from 1.02 ± 0.03 units to 0.63 ± 0.02 units by high glucose (P < 0.05), and it was maintained at higher levels (0.76 ± 0.07) in the presence of paroxetine (10 μmol/L; n = 3). Oxidative damage of mitochondrial proteins also was detectable in hyperglycemic cells by the OxyBlot technique, as evidenced by a 1.5-fold increase in the level of oxidized proteins in the range of 20–45 kDa; this effect also was attenuated by paroxetine (Fig. 6D).

Figure 6.
Paroxetine reduces hyperglycemia-induced oxidative damage in endothelial cells. bEnd.3 cells were exposed to hyperglycemia (high) or maintained in medium containing normal glucose (low) for 10 days and treated with paroxetine (PRX; 10 μmol/L) or vehicle (CTL) for 3 days. Representative micrographs and respective bar graphs of the Comet assay (A, C); 8-hydroxy-guanosine (red) immunostaining with simultaneous Hoechst 33342 (blue) nuclear and phalloidin (green) actin staining (B) are shown. D: Crude mitochondrial fractions were prepared and processed with OxyBlot Protein Oxidation Detection Kit. Representative blot image of oxidized proteins and densitometric analysis are shown. *P < 0.05 compared with normoglycemic cells; #P < 0.05 compared with hyperglycemic cells.
Paroxetine Prevents the Hyperglycemia-induced and Diabetes-induced Endothelial Dysfunction in Vascular Rings
Isolated rat aortic rings exposed to hyperglycemia ex vivo had development of endothelial dysfunction, as evidenced by an impaired relaxation in response to acetylcholine (Fig. 7A). Paroxetine attenuated the loss of endothelium-dependent relaxant responsiveness of the hyperglycemic vessels. Next, we tested the ability of paroxetine to affect the development of endothelial dysfunction in streptzotocin diabetic rats. Paroxetine did not affect body weight and did not influence the degree of hyperglycemia in the diabetic animals (Fig. 7B). However, the diabetes-induced impairment of the endothelium-dependent relaxations ex vivo was prevented by paroxetine treatment (Fig. 7C).
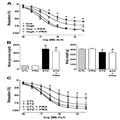
Figure 7.
The protective effect of paroxetine in ex vivo vessels and in vivo. A: Rat thoracic aortic rings were exposed to 30 mmol/L hyperglycemia (high) for 48 h or incubated in culture medium containing 5 mmol/L glucose (low) and were treated with paroxetine (PRX; 10 μmol/L) or vehicle. Endothelium-mediated relaxation to acetylcholine (Ach) was measured at the indicated concentrations of acetylcholine and expressed as percent of precontraction. B: Paroxetine treatment of streptozotocin-diabetic rats failed to affect hyperglycemia or body weight loss. C: Rat thoracic aortic rings prepared from streptozotocin-diabetic (STZ) or control nondiabetic (CTL) rats treated with vehicle or paroxetine (PRX; 10 mg/kg per day). Endothelium-mediated relaxation to acetylcholine was measured at the indicated concentrations of acetylcholine and expressed as percent of precontraction. #P < 0.05 hyperglycemia/diabetes compared with normoglycemic samples (low); *P < 0.05 paroxetine treatment compared with hyperglycemia/diabetes.
Diabetes. 2013;62(3):953-964. © 2013 American Diabetes Association, Inc.


