Fox News Flash top headlines for May 5
Fox News Flash top headlines are here. Check out what's clicking on Foxnews.com.
Two new satellite images reveal that Earth's ice melt is noticeable from space.
The new maps -- published Thursday as part of a study in the journal Science -- vividly depict 16 years of ice loss in Greenland and Antarctica as viewed by laser-emitting NASA satellite images.
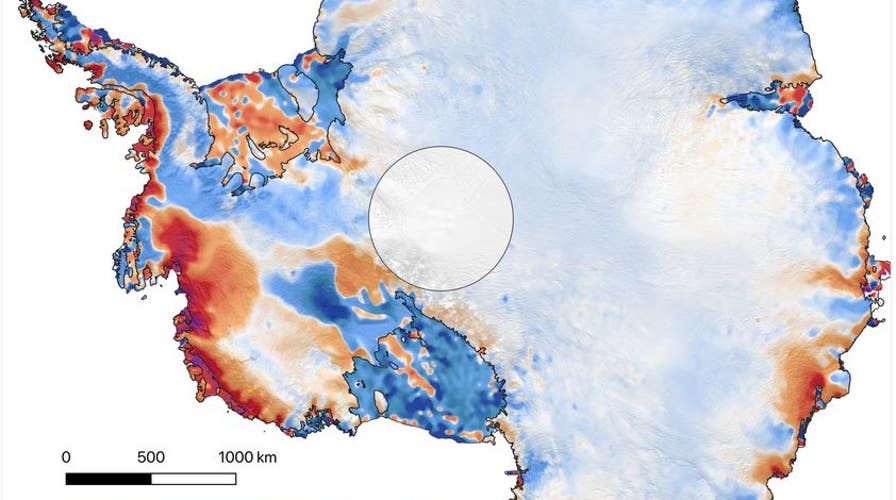
The images paint a picture of rapidly-melting ice along the coasts of both regions -- shown in red and purple in the maps -- seeming to outweigh the modest ice-mass gains inland, which are shown in light blue.
According to the study, Greenland’s ice sheet lost an average of 200 gigatons of ice per year, and Antarctica’s ice sheet lost an average of 118 gigatons of ice per year. One gigaton of ice is enough to fill 400,000 Olympic-sized swimming pools.
SECRET, WOOD-LINED TUNNEL UNEARTHED BY ARCHAEOLOGISTS
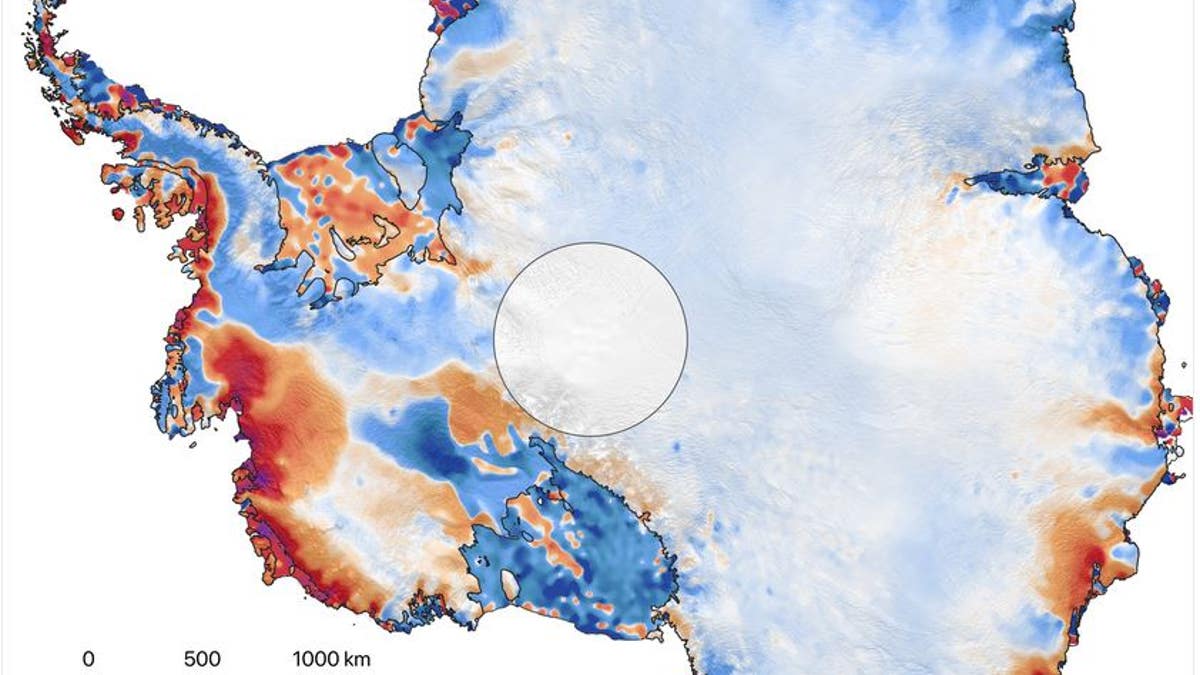
This shows the amount of ice gained or lost by Antarctica between 2003 and 2019. Dark reds and purples show large average rates of ice loss near the Antarctic coast, while blues show smaller rates of ice gain in the interior. The ice lost near the coasts, especially West Antarctica and the Antarctic Peninsula, vastly outweigh gains in the interior. (Smith et al./Science) (Smith et al./Science)
“It was amazing to see how good the ICESat-2 data looked, right out of the gate,” said co-author Tom Neumann, from NASA’s Goddard Space Flight Center in Greenbelt, Md. “These first results looking at land ice confirm the consensus from other research groups, but they also let us look at the details of change in individual glaciers and ice shelves at the same time.”
Of the sea level rise that resulted from ice sheet meltwater and iceberg calving, about two-thirds of it came Greenland with the other third from Antarctica, the researchers said.
“The new analysis reveals the ice sheets’ response to changes in climate with unprecedented detail, revealing clues as to why and how the ice sheets are reacting the way they are,” co-author Alex Gardner, a glaciologist at NASA’s Jet Propulsion Laboratory in Pasadena, Calif., said in a statement.
RECENTLY RECOVERED COVID-19 PATIENTS PRODUCE DIFFERING VIRUS-SPECIFIC ANTIBODIES
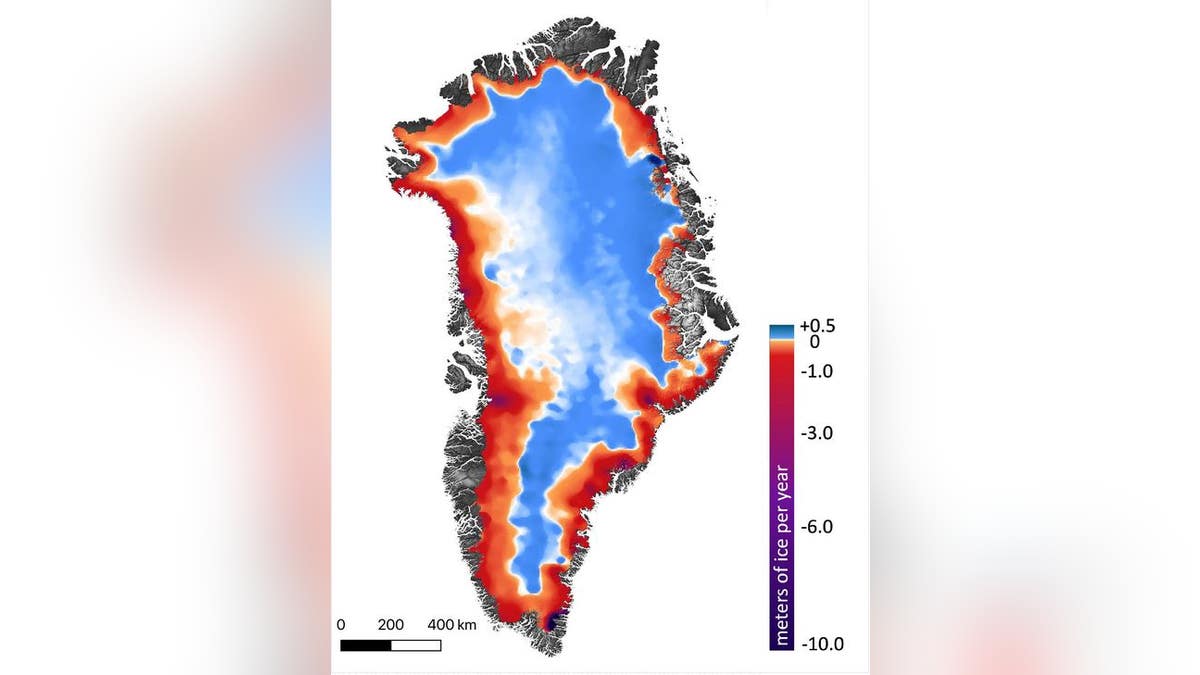
This shows the amount of ice gained or lost by Greenland between 2003 and 2019. Dark reds and purples show large rates of ice loss near the coasts. Blues show smaller rates of ice gain in the interior of the ice sheet. (Smith et al./Science) (Smith et al./Science)
“In West Antarctica, we’re seeing a lot of glaciers thinning very rapidly,” Smith said. “There are ice shelves at the downstream end of those glaciers, floating on water. And those ice shelves are thinning, letting more ice flow out into the ocean as the warmer water erodes the ice.”

Get a daily look at what’s developing in science and technology throughout the world.