Read This Before You Buy Sun.King Power Electronics Group Limited (HKG:580) Because Of Its P/E Ratio

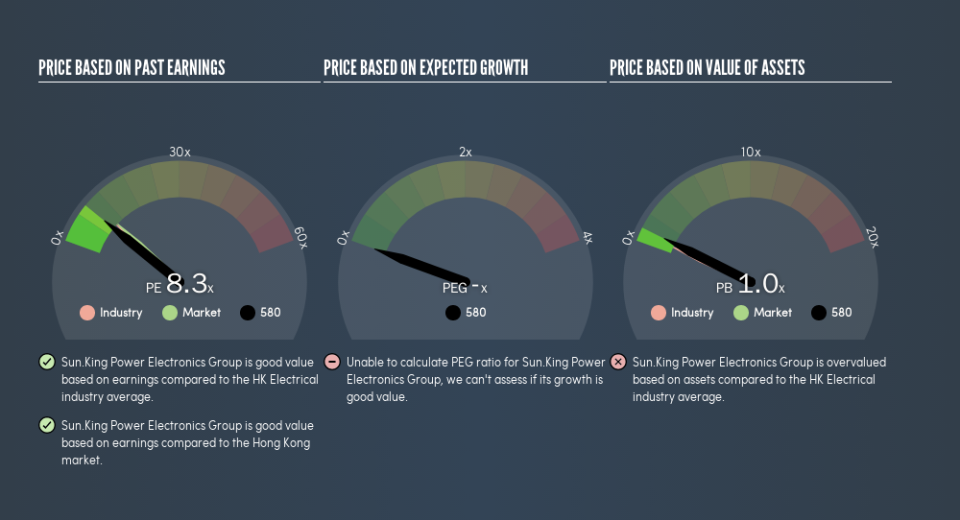
The goal of this article is to teach you how to use price to earnings ratios (P/E ratios). We'll show how you can use Sun.King Power Electronics Group Limited's (HKG:580) P/E ratio to inform your assessment of the investment opportunity. Based on the last twelve months, Sun.King Power Electronics Group's P/E ratio is 8.25. That is equivalent to an earnings yield of about 12%.
See our latest analysis for Sun.King Power Electronics Group
How Do I Calculate A Price To Earnings Ratio?
The formula for price to earnings is:
Price to Earnings Ratio = Price per Share (in the reporting currency) ÷ Earnings per Share (EPS)
Or for Sun.King Power Electronics Group:
P/E of 8.25 = CN¥0.94 (Note: this is the share price in the reporting currency, namely, CNY ) ÷ CN¥0.11 (Based on the trailing twelve months to December 2018.)
Is A High Price-to-Earnings Ratio Good?
The higher the P/E ratio, the higher the price tag of a business, relative to its trailing earnings. That is not a good or a bad thing per se, but a high P/E does imply buyers are optimistic about the future.
How Does Sun.King Power Electronics Group's P/E Ratio Compare To Its Peers?
We can get an indication of market expectations by looking at the P/E ratio. If you look at the image below, you can see Sun.King Power Electronics Group has a lower P/E than the average (9.5) in the electrical industry classification.
This suggests that market participants think Sun.King Power Electronics Group will underperform other companies in its industry. Many investors like to buy stocks when the market is pessimistic about their prospects. You should delve deeper. I like to check if company insiders have been buying or selling.
How Growth Rates Impact P/E Ratios
Earnings growth rates have a big influence on P/E ratios. If earnings are growing quickly, then the 'E' in the equation will increase faster than it would otherwise. That means even if the current P/E is high, it will reduce over time if the share price stays flat. And as that P/E ratio drops, the company will look cheap, unless its share price increases.
Sun.King Power Electronics Group saw earnings per share decrease by 18% last year. But EPS is up 29% over the last 5 years.
A Limitation: P/E Ratios Ignore Debt and Cash In The Bank
The 'Price' in P/E reflects the market capitalization of the company. In other words, it does not consider any debt or cash that the company may have on the balance sheet. The exact same company would hypothetically deserve a higher P/E ratio if it had a strong balance sheet, than if it had a weak one with lots of debt, because a cashed up company can spend on growth.
Such expenditure might be good or bad, in the long term, but the point here is that the balance sheet is not reflected by this ratio.
How Does Sun.King Power Electronics Group's Debt Impact Its P/E Ratio?
With net cash of CN¥440m, Sun.King Power Electronics Group has a very strong balance sheet, which may be important for its business. Having said that, at 29% of its market capitalization the cash hoard would contribute towards a higher P/E ratio.
The Verdict On Sun.King Power Electronics Group's P/E Ratio
Sun.King Power Electronics Group's P/E is 8.3 which is below average (10) in the HK market. Falling earnings per share are likely to be keeping potential buyers away, but the net cash position means the company has time to improve: if so, the low P/E could be an opportunity.
Investors should be looking to buy stocks that the market is wrong about. If it is underestimating a company, investors can make money by buying and holding the shares until the market corrects itself. So this free visual report on analyst forecasts could hold the key to an excellent investment decision.
Of course you might be able to find a better stock than Sun.King Power Electronics Group. So you may wish to see this free collection of other companies that have grown earnings strongly.
We aim to bring you long-term focused research analysis driven by fundamental data. Note that our analysis may not factor in the latest price-sensitive company announcements or qualitative material.
If you spot an error that warrants correction, please contact the editor at editorial-team@simplywallst.com. This article by Simply Wall St is general in nature. It does not constitute a recommendation to buy or sell any stock, and does not take account of your objectives, or your financial situation. Simply Wall St has no position in the stocks mentioned. Thank you for reading.
