Every two hours, Craig Stevens gets a text message from Antarctica.
The messages come from a narrow, hugely expensive metal tube suspended in the Southern Ocean beneath the Ross Ice Shelf. The tube contains sensors that periodically record the temperature, salinity and currents at various depths of the surrounding water. The instrument then relays the measurements by satellite phone to Stevens, an oceanographer at the National Institute of Water and Atmospheric Research in Wellington, New Zealand.
The data provide glimpses into one of the most remote and little-known environments on Earth. “We had photographs back from the surface of Venus before we’d seen what was beneath an ice shelf,” says Stevens. Almost no one has ever ventured under one of these vast, floating ledges of ice.
On supporting science journalism
If you're enjoying this article, consider supporting our award-winning journalism by subscribing. By purchasing a subscription you are helping to ensure the future of impactful stories about the discoveries and ideas shaping our world today.
But what goes on underneath Antarctica’s ice shelves is hugely important. The interface between ice and ocean influences how climate change affects global sea level, ocean currents, weather patterns and marine ecosystems.
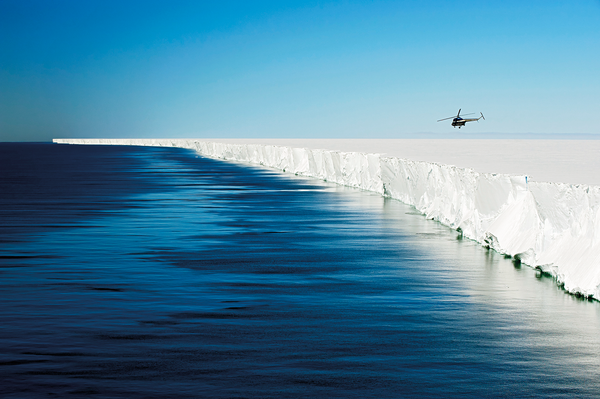
About three-quarters of the Antarctic coastline is covered by ice shelves—floating expanses of ice formed by glaciers merging as they flow out to sea. There are around 300 of these ice shelves, covering more than 1.6 million square kilometres. The largest, the Ross Ice Shelf, is roughly the size of Spain; the ocean underneath it contains as much water as the North Sea.
Friction between the ice shelf and the bedrock, where the ice touches the sea floor or the surrounding coastline, exerts a backwards force that slows the flow of ice and stabilizes the glaciers behind it. When an ice shelf collapses or becomes too thin, the ice sheet over the land flows into the ocean more rapidly. It is this influx of land-based ice that contributes to sea-level rise.
And that contribution is increasing. According to a September 2019 report1 from the Intergovernmental Panel on Climate Change (IPCC), melting of the world’s ice sheets caused sea level to rise by 1.2 millimetres per year between 2012 and 2016, a sevenfold increase over the figure two decades before. Antarctica’s ice sheets cover 14 million square kilometres and Greenland’s extend for 1.7 million square kilometres. These ice sheets will be the main driver of sea-level rise in this century and beyond, the report said.
But it is not clear how much of the ice sheets will be lost, by what mechanisms, and in what time frame, particularly in Antarctica. “This adds hugely to the uncertainty in the contribution to future sea-level rise,” says Keith Nicholls, an oceanographer at the British Antarctic Survey in Cambridge, UK.
To predict sea-level rise more confidently, scientists need a better understanding of what happens at the ice–ocean interface. This will also help them understand how climate change is likely to influence other aspects of the ocean that are affected by melt water from ice shelves and ice sheets, such as patterns of ocean circulation and the global transport of heat and nutrients.
Look out below
An ice shelf shrinks in one of two main ways. The first, calving of icebergs from the seaward edge, is dramatic and easy to recognize. The second, melting of the ice shelf from below, is hidden, but turns out to be the more important mechanism.
Stanley Jacobs, an oceanographer at the Lamont-Doherty Earth Observatory in Pali-sades, New York, has been making research cruises to the Antarctic since the 1960s. He says it was clear even then that the ice shelves were interacting with the water around them. “They were sitting in the ocean,” he says, “and in some cases they were melting at the bottom, based on ocean measurements near the ice front.”
But this melting at the bottom, called basal melt, was hard to quantify until satellite observation of Antarctica began in the 1970s. Satellite measurements of ice-shelf thickness have shown that some of Antarctica’s ice shelves experience more basal melt than others and are thinning. In 2013, an estimate2 based on satellite data suggested that Antarctica’s ice shelves were experiencing a net loss of 287 billion tonnes of ice per year (see ‘An icy land’).

The Antarctic ice sheet comprises two distinct ice sheets, East and West, which have different dynamics. An analysis3 based on satellite data collected between 1994 and 2012 showed that in East Antarctica, ice shelves thickened in the first half of that period but then stopped accumulating mass. In West Antarctica, thinning of the ice shelves occurred throughout the study period and accelerated over time.
Thinning of the West Antarctic ice shelves is of particular concern because much of the West Antarctic ice sheet lies below sea level, making it more susceptible to runaway collapse than the higher-elevation East Antarctic ice sheet.
The ice shelves experiencing the most rapid thinning are clustered along the shores of the Amundsen and Bellingshausen seas. Here, a water mass known as Circumpolar Deep Water, which normally flows around Antarctica just off the continental shelf, is able to enter cavities under the ice shelves. Circumpolar Deep Water is relatively warm, which by Antarctica’s frigid standards means a few degrees above the freezing point of sea water at depth. It can therefore rapidly melt ice shelves from underneath, and so poses a considerable threat to ice shelves in West Antarctica.
Studies suggest that some of the ice shelves in the Amundsen and Bellingshausen seas are nearing a tipping point or might already be doomed to disappear. But the Antarctic is a highly variable environment. With only a few decades’ worth of measurements, it is hard to know what is natural variability and what is not.
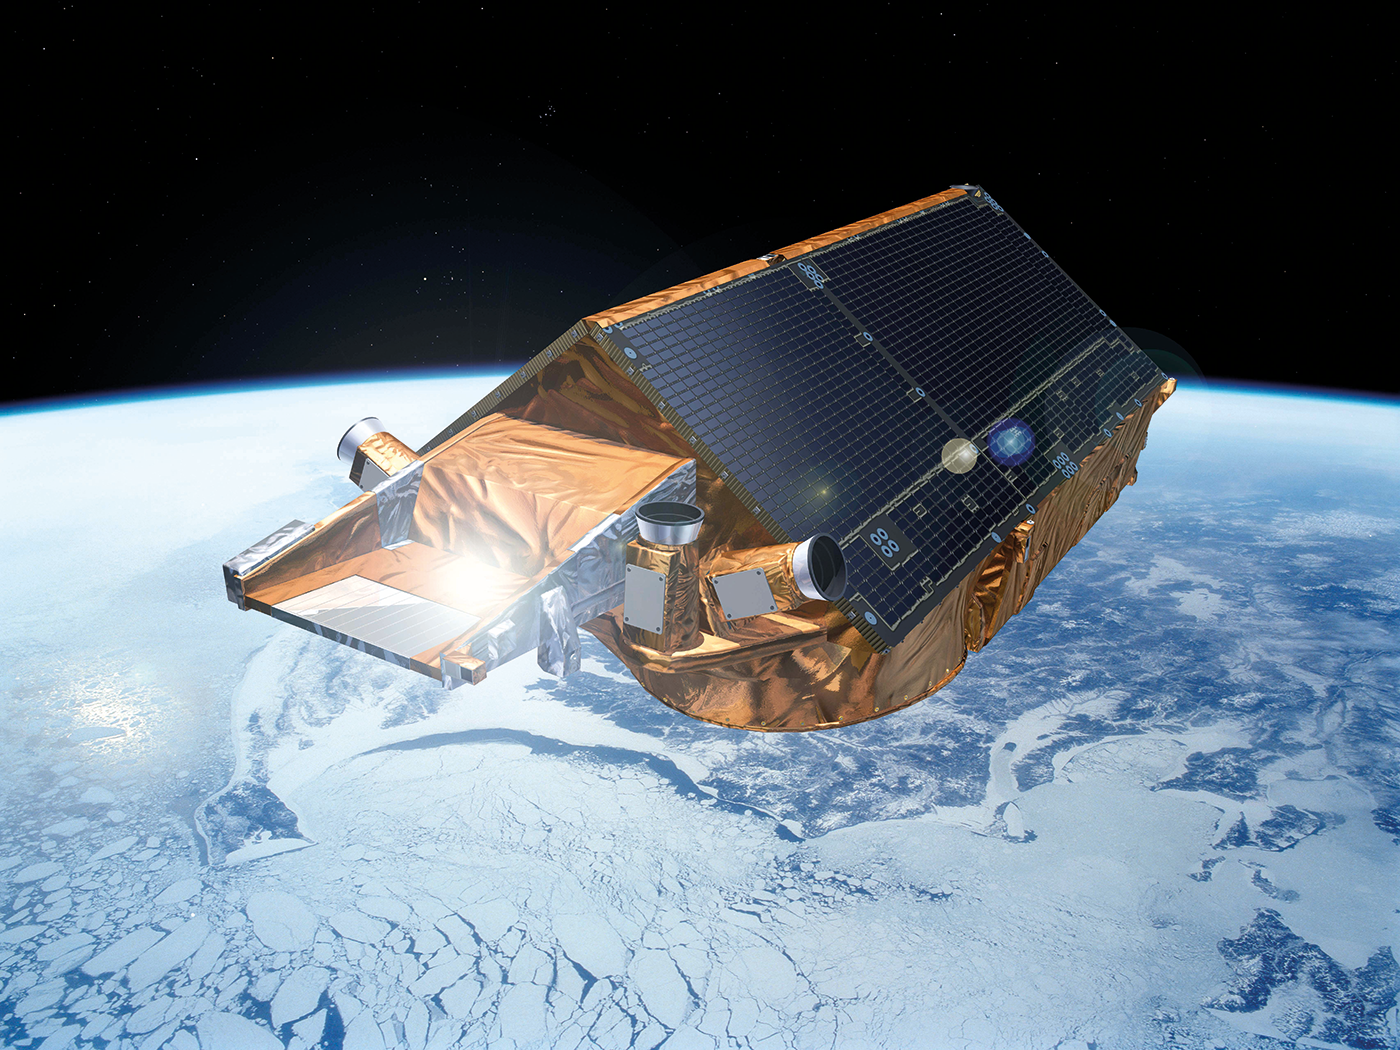
Credit: CryoSat-2 measures ice-sheet thickness
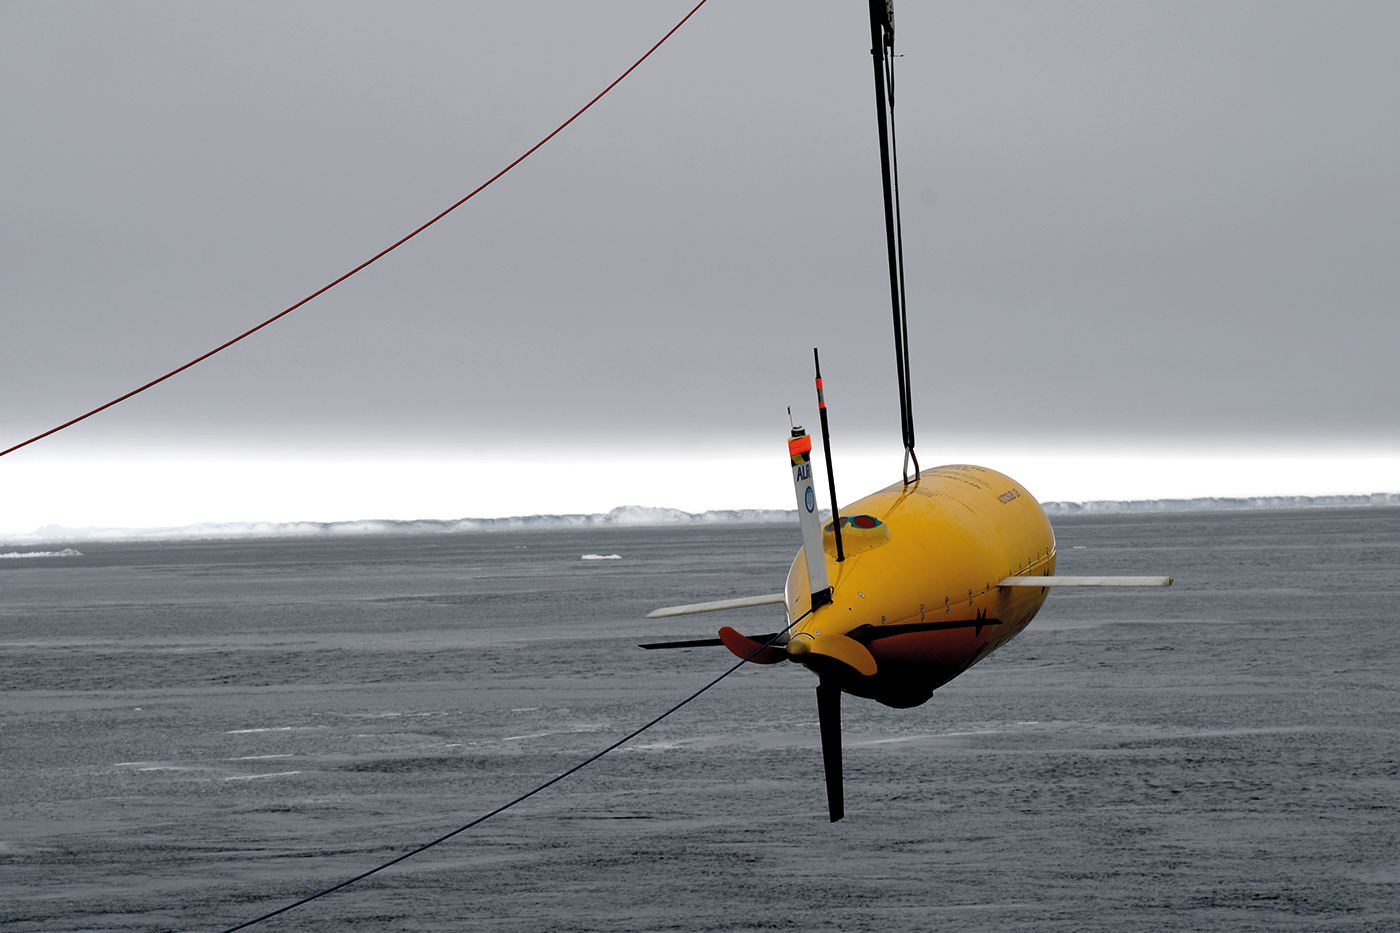
Autosub can record data beneath ice shelves. Credit: Svein østerhus
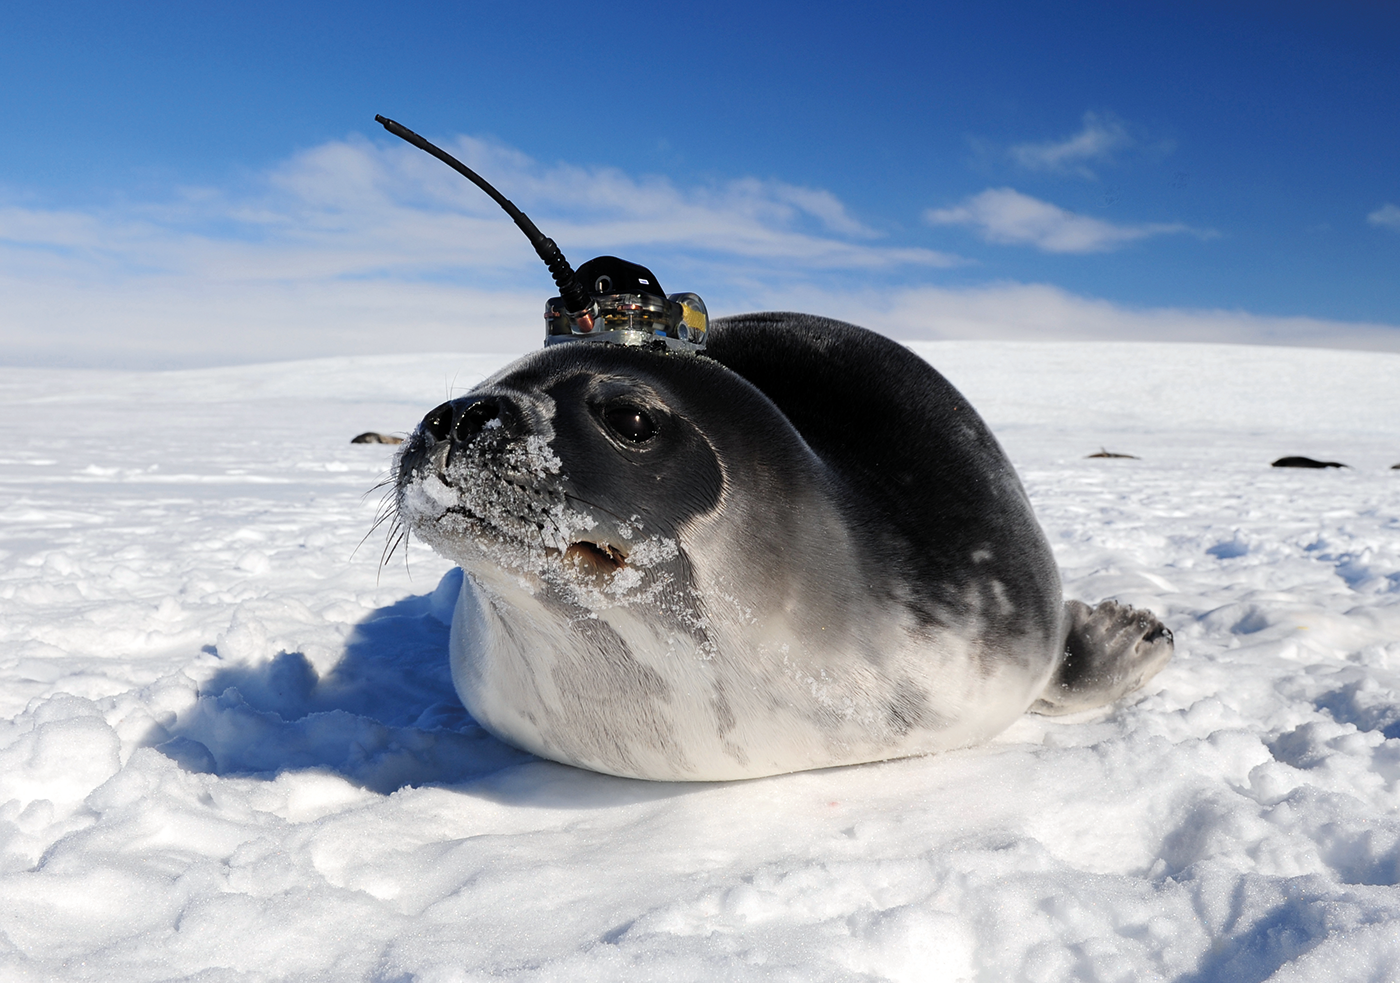
Weddell seals are useful research assistants. Credit: Dan Costa, USCS
Tools of the trade
Whether observing the Antarctic ice from on high or enlisting the locals to monitor the ocean, scientists are finding a variety of ways to study ice shelves, the nearby ocean, and the hidden ocean that lies beneath the ice.
Satellites
A satellite passing over an ice shelf can use an altimeter to measure the height of the ice. With repeated orbits and repeated measurements, the satellite can build a record of changes in the thickness of the ice over time. This creates a big-picture view of the ice shelf, but it has limited precision and cannot track changes over the short term or at fine spatial scales. Two altimetry satellites are currently in orbit: NASA’s ICESat-2, which uses a laser altimeter to measure the ice thickness, and the European Space Agency’s CryoSat-2, which has a radar system on board.
Ground-based radar
Ground-based radar systems allow scientists to track changes in ice-shelf thickness with sub-millimetre precision on an hourly scale, giving insight into how tides and currents in the ice-shelf cavity contribute to melting and refreezing on the underside of the ice shelf. Early versions of these instruments were expensive and unwieldy, but a system known as ApRES, developed by Keith Nicholls and other scientists at the British Antarctic Survey in Cambridge, UK, costs only £5,000 (US$6,400) to deploy and can run indefinitely using a solar panel attached to a car battery. Its low cost makes it feasible to track multiple locations on an ice shelf at once.
Boreholes
Using a blast of warm water to drill a hole through hundreds of metres of ice is an expensive and complex undertaking. But it provides direct access to the ocean underneath an ice shelf—including locations hundreds of kilometres inland from the edge of an ice shelf that are difficult to reach by other methods. Scientists can lower an array of cameras, sensors and other sampling equipment through the hole to obtain a detailed picture of ocean dynamics. Although this approach yields data on only a single location under the ice shelf, instruments can be left to gather data for several years.
Autonomous underwater vehicles and gliders
Uncrewed submarines equipped with state-of-the-art oceanographic instruments can travel deep below the surface of the ocean and far into the cavity under an ice shelf. This gives researchers a broad view of the ice-shelf cavity, rather than restricting them to a handful of measurements at specific points. Autonomous underwater vehicles (AUVs) can document the shape and depth of the ice shelf, as well as troughs and ridges on the sea floor that can affect the circulation of water under the shelf.
Researchers are also beginning to use smaller autonomous vehicles called gliders that can explore areas of the ocean without any human assistance for days or weeks at a time—much longer than larger AUVs. But both types of vehicle require research ships to deploy and retrieve them, limiting their use to months when the Southern Ocean is passable.
Moorings and floats
Oceanographic moorings (instruments tethered to the sea floor) and autonomous floats (which can move up and down in the water) are used to build profiles of ocean conditions near ice shelves over long periods of time. For example, floats have gathered three years’ worth of data on the Ross Sea continental shelf. Because floats can be programmed to rise and descend at specific times, they can remain underwater during the months when sea ice covers the surface.
Marine mammals
Electronic devices that measure conductivity, temperature and depth (known as CTD tags) are often attached to marine mammals such as seals in ecological studies, but physical oceanographers are also beginning to make use of these data. The Marine Mammals Exploring the Oceans Pole to Pole (MEOP) consortium collects data from tagged animals and makes them available to scientists. The MEOP-CTD database contains more than 500,000 oceanographic profiles collected by tagged marine mammals worldwide. It is estimated that 70% of all such data from south of a latitude of 60 degrees south have been collected by these mammalian research assistants. The animals often have wide ranges and are able to navigate areas covered by sea ice in winter.
Winds of change
One way of knowing what is natural is to model the Antarctic ice shelves over long periods of time. But before scientists can model what happens over the course of a century, they need to understand what goes on around and underneath the ice shelves over periods of days and weeks. However, “it’s not easy to gather measurements using traditional oceanographic tools” in the Antarctic environment, says Jiping Liu, a polar researcher at the State University of New York in Albany.
Consider the sensor that sends messages to Stevens in New Zealand from beneath the Ross Ice Shelf. Putting the device there involved a multimillion-dollar effort in which a team from Victoria University of Wellington first heated up a bedroom-sized reservoir of warm water within the ice shelf, then used this water to melt two holes 25 centimetres in diameter through ice more than 300 metres deep.
Science in such a hostile environment requires both careful planning and creative improvisation. When weather conditions prevented the arrival of state-of-the art camera equipment, Stevens and his team used an action camera in a high-pressure housing to film underneath the ice shelf—equipment that “at the last minute you throw into your bag and it turns out to be useful”, he says.
Sometimes the setbacks are more serious. In February 2005, a UK-built uncrewed submarine known as the Autosub was trapped under a small ice shelf in the eastern Weddell Sea when an underwater electronic connector failed. “A lot of work you do in the Antarctic, you don’t get a sense of joy when you finish successfully,” says Nicholls, who led the mission. “You just get a sense of relief that it didn’t all go horribly wrong.”
Despite these occasional setbacks, the combination of satellite measurements, data gathered by a variety of oceanographic techniques (see ‘Tools of the trade’) and modelling studies is now revealing complex interactions and feedback loops that affect basal melt in Antarctic ice shelves—especially the vulnerable ice shelves at the edges of the West Antarctic ice sheet.
More Circumpolar Deep Water is reaching those ice shelves today than in the past because of a change in wind direction. When winds blow from the west, the Coriolis force resulting from the rotation of the Earth pushes cold surface water to the north, away from the Antarctic coastline. This enables more upwelling of warmer Circumpolar Deep Water, which melts the undersides of ice shelves in the Amundsen Sea.
Researchers have known for a decade that winds along the West Antarctic coastline are becoming more westerly. This process does not seem to be part of a natural cycle but is a result of human activities. There is a “clear argument for the connection between the loss that we’re seeing and global warming”, says Eric Steig, a glaciologist at the University of Washington in Seattle, who led a study on this.
At the moment, Circumpolar Deep Water can access the continental shelf along about one-quarter of Antarctica’s western coastline. But modelling suggests that by 2100, shifts in ocean circulation resulting from climate change could allow this water mass to reach new areas, and threaten some of the continent’s largest ice shelves, such as the Ross Ice Shelf. Some parts of East Antarctica, especially the Totten Glacier, might also be more vulnerable to Circumpolar Deep Water than previously thought.
One section of the Ross Ice Shelf is already exhibiting some changes. Shifts in wind direction are blowing sea ice away from the ocean in front of the shelf, creating larger than normal ice-free areas known as polynyas. The dark, ice-free water absorbs more solar heat in the summer than does light-coloured sea ice, so the water heats up, increasing melting of the ice shelves.
Wider integration
The next step is to integrate Antarctic ice-shelf dynamics with those of the Greenland ice sheet on the other side of the world. Greenland’s glaciers terminate in narrow fjords that leave no room for ice shelves to form. Instead, surface melt water percolates through cracks in the ice sheet and enters the ocean hundreds of metres below the surface.
“One of the hardest things to measure is this flux at the base of glaciers,” says Fiamma Straneo, an oceanographer at Scripps Institution of Oceanography in San Diego, California. But, she says, “this gives rise to a whole set of really interesting and exciting dynamics”.
Straneo and her colleagues have documented how the plume of fresh melt water rises rapidly against the steep face of the glacier, increasing melting at the glacier’s face in much the same way that ice in a drink melts faster when stirred by a spoon. They have also shown that Greenland has its own source of warm water: tropical and subtropical waters carried on deep-sea currents to the Greenland coast, mainly on the island’s southeastern and western coasts.
The bigger picture is starting to come into view. Earlier this year, researchers published the first analysis4 of how melting of both the Greenland and Antarctic ice sheets might affect the global climate. The study suggests that these processes will drive more variable weather, bring more hot and cold extremes, and weaken deep ocean circulation in the North Atlantic, affecting the global transport of heat and nutrients through the oceans and potentially altering weather patterns.
Scientists are also working on a comprehensive effort to harmonize different ice-sheet models and couple them with larger climate models in the Ice Sheet Model Intercomparison Project. The aim is to include interactions between ice sheets and ocean water in the IPCC’s Sixth Assessment Report, which is due to be published in 2022. Until now, the panel’s models and reports have not included this aspect of the global climate system.
This is a sign that the scientific understanding of events beneath ice shelves and at the margins of ice sheets is beginning to come of age. But there is still a long way to go. “We desperately need more observations to constrain the models, as well as more models testing all these new processes,” says Nicholas Golledge, a glaciologist at the Victoria University of Wellington who led the analysis. “Pretty much every element of the system we’re trying to model has huge unknowns.”
H.-O. Pörtner et al. IPCC Special Report on the Ocean and Cryosphere in a Changing Climate (2019).
Rignot, E. et al.Science341, 266–270 (2013).
Paolo, S. et al.Science348, 327–331 (2015).
Golledge, N. R. et al.Nature566, 65–72 (2019).