
Abstract
Sustainable land-use planning should consider large-scale landscape connectivity. Commonly-used species-specific connectivity models are difficult to generalize for a wide range of taxa. In the context of multi-functional land-use planning, there is growing interest in species-agnostic approaches, modelling connectivity as a function of human landscape modification. We propose a conceptual framework, apply it to model connectivity as current density across Alberta, Canada, and assess map sensitivity to modelling decisions. We directly compared the uncertainty related to (1) the definition of the degree of human modification, (2) the decision whether water bodies are considered barriers to movement, and (3) the scaling function used to translate degree of human modification into resistance values. Connectivity maps were most sensitive to the consideration of water as barrier to movement, followed by the choice of scaling function, whereas maps were more robust to different conceptualizations of the degree of human modification. We observed higher concordance among cells with high (standardized) current density values than among cells with low values, which supports the identification of cells contributing to larger-scale connectivity based on a cut-off value. We conclude that every parameter in species-agnostic connectivity modelling requires attention, not only the definition of often-criticized expert-based degrees of human modification.
Introduction
Land-use and land-cover changes have impacted many natural ecosystems to provide ecosystem goods and services for an ever-growing human population1. This often has unintended consequences that may threaten biodiversity and ecosystem health2. Such consequences include changes in local, regional, and global climate3, alteration of natural habitats4, pollution of land, air, and water5,6,7, and changes in landscape structure, i.e., the total area and spatial configuration of ecosystems8.
Natural ecosystems offer habitat for many species, and human landscape modification typically involves habitat loss as well as the breaking up of continuous habitats into smaller remnant patches (fragmentation)9,10. Consequently, landscapes may lose connectivity, i.e., the degree to which they facilitate movement of organisms and their genes among patches11,12. Landscape connectivity can be quantified in three ways: structural landscape connectivity, potential functional connectivity, and actual functional connectivity13. Structural landscape connectivity can be determined from physical attributes, based on maps alone without reference to organismal movement behaviour. Potential functional connectivity relies on a set of assumptions on organismal movement behaviour to implement an organism perspective, e.g. by mapping a species’ habitat and setting a dispersal threshold. In contrast, actual functional connectivity refers to observed data (e.g., patch occupancy, radio tracking, mark-recapture, or molecular genetic data) that reflect actual rates of the exchange of individuals (or their genes) and may be used to test models of structural or potential functional connectivity13. As landscape connectivity facilitates organism dispersal, gene flow, and many other ecological functions of a landscape14, its erosion is a major concern for wildlife population survival, due to increase of extinction risk, loss of species diversity, and disruption of major ecosystem services11,15,16,17. For these reasons, connectivity is considered a key aspect of land-use planning and conservation management18,19.
Connectivity maps are sensitive to the way connectivity models are conceptualized and implemented20,21, and there is no general consensus on which approach should be used preferentially to support planning. The most common approach to modelling connectivity is the focal species approach10,22. This bottom-up approach considers one or a few species that serve as surrogates to characterize connectivity for a larger suite of species23. It aims to evaluate the potential functional connectivity of a species’ habitat by taking into account species-specific dispersal thresholds and modelling the impeding effect of different feature types on movement as resistance values24. However, because species differ, e.g., in habitat requirements, body size, dispersal ability, or lifespan, the effect of habitat fragmentation on functional connectivity can differ importantly25,26. For this reason, the effectiveness of such an approach to evaluate connectivity for a suite of species is highly debated27,28,29. In addition, large-scale analyses may require large numbers of focal species to represent diverse habitat types20. To overcome these limitations, there is growing interest in applying a top-down approach, which does not rely on biological or ecological characteristics for specific taxa to model large-scale connectivity maps for management and planning efforts30,31, recently known as a “species-agnostic” approach (e.g.32). More specifically, these models are solely based on quantifying the degree of unnaturalness in the landscapes which are caused by human modifications29 as well as other ecological and geochemical processes. Indeed, the approach is based on the assumption that natural terrestrial areas facilitate connectivity, and the higher the degree of human modification, the more the ‘ecological flow’ is restricted. Models based on structural connectivity are not new. For instance, effective mesh size30 likewise does not make reference to species characteristics. It is important to note that even a species-agnostic approach will be parameterized with a certain group of species in mind, in this case terrestrial organisms20,33.
Because large water bodies, despite being natural features, may disrupt the movement of many terrestrial organisms, some authors have treated them as a barrier34. The hydrological connectivity of aquatic habitats, on the other hand, should be modelled separately as it has a linear network structure.
More generally, focal-species and species-agnostic approaches both are known to be sensitive to resistance values, which are often based on expert opinion, and a rigorous assessment of the sensitivity to parameter settings is required35,36,37. For instance, Koen et al.28 successfully validated a species-agnostic model of landscape connectivity with road mortality data of reptiles and amphibians and with molecular genetic data for a mammalian species. Connectivity models are also known to be sensitive to the degree of contrast between high-resistance and low-resistance landscape features, which can be modified with a scaling function38,39. Moreover, Arponen et al.40 demonstrated that the spatial resolution of large-scale connectivity maps has an influence on the prioritization of areas for conservation. Nevertheless, parameterization and optimization of resistance surfaces in a biologically and ecologically relevant way for functional connectivity across species remains a nontrivial challenge41, and a better understanding of the relative importance of these factors is needed. Given a resistance surface, connectivity can be evaluated either by least cost path analysis24 or by quantifying current density based on circuit theory32,42. The latter approach is commonly used in landscape ecology and genetics studies32,42 as it allows for multiple movement pathways and varying degrees of corridor use across the landscape43. This makes it possible to investigate multiple corridor routing options44.
The spatial resolution of resistance maps has been shown to affect the accuracy of resulting connectivity maps through its effect on many landscape pattern metrics (e.g.45,46,47), including connectivity metrics48. Indeed, increasing spatial resolution (grain size) has a large effect on the accuracy of circuit-based connectivity estimates37. However, until recently49, computational limitations have precluded the use of circuit theory models to compute connectivity for large-extent, high-resolution maps29,50. Consequently, wall-to-wall, large-scale, and fine-grain computation of connectivity maps using circuit theory remains largely understudied, despite of increasing demand and recent expansions of this modelling approach10,28,34,51. Recent computational advances, namely the availability of GFlow49 and the new implementation of Circuitscape52 in Julia, have overcome previous computational limitations of Circuitscape and provide an important opportunity for developing and testing large-scale connectivity models based on current density.
Here we (i) propose a conceptual framework for species-agnostic connectivity modelling based on current density; (ii) discuss conceptual and computational decisions involved in implementing the approach; and (iii) assess the degree of uncertainty related to these decisions. The applied goal is to derive one main wall-to-wall map of current density as a measure of species-agnostic connectivity for Alberta based on the degree of human modification. The province of Alberta, Canada, is aiming to integrate an index of landscape connectivity into their biodiversity and ecosystem services assessment framework53. The Alberta Biodiversity Monitoring Institute (ABMI) is systematically collecting data on both human footprints and biodiversity for the province of Alberta at a level of detail, spatial extent, and spatiotemporal resolution that are unique at least for North America54 (see also the ABMI’s 10-year Science and Program Review, https://abmi10years.ca). Alberta, with a total area of 661,848 km2, has a human population of over 4 million (2016 census) and one of the biggest economies in Canada, including an expanding petroleum industry and significant contributions from agriculture, forestry, and tourism55. Because of rapid growth in population and economic activity, Alberta’s landscapes have changed noticeably over recent decades, and the rate of development is expected to increase further56, adding unprecedented pressure on remaining natural areas and low-intensity land uses57,58. Alberta defined a Land-use Framework53,59 to manage and sustain a growing economy, while balancing this with Albertan’s social and environmental goals. To improve land-use planning and biodiversity management in Alberta, policy makers, landowners, and other stakeholders are thus in need of new tools to evaluate the ecological value of ecosystems and landscapes, including an assessment of the contribution of an area to larger-scale connectivity, so as to compare the impact of alternative development scenarios and prioritize areas for conservation and restoration.
After deriving a main wall-to-wall map of current density as a measure of species-agnostic connectivity for Alberta based on the degree of human modification, we use this example to compare the contributions of different factors to uncertainty. We thus assess the sensitivity of this map to (i) the definition of the degree of human modification (i.e., the relative weight given to degree of physical human footprint vs. intensity of human use), (ii) the decision whether water bodies are considered barriers to movement, and (iii) the scaling function used to translate degree of human modification into resistance values. While the influence of most of these parameters on connectivity patterns has been previously studied independently, we aim to directly compare their contributions to uncertainty. We further (iv) evaluate the effect of such uncertainty on the classification of cells as being important or less important for maintaining larger-scale connectivity using different cut-off values. This study prepares the ground for future research to evaluate model validity with Alberta’s extensive biodiversity monitoring data.
Conceptual framework
We argue that a species-agnostic approach is conceptually better suited for integrating landscape connectivity into land-use planning, whereas a focal-species approach is better suited for conservation management (Fig. 1). Understanding the difference between these perspectives can help clarify conceptual differences, guide researchers in making decisions about how to model connectivity, and inform practitioners about the potential and limitations of resulting maps. Conservation is often based on focal species, e.g., in species-at-risk management, where it is paramount to adopt an organism perspective60 to define critical habitat and to consider the organism’s ability to move between habitat patches. This will result in a model of potential functional connectivity for the specific organism of interest, and a multi-species model can be derived by overlaying models for a representative suite of species10,22. In contrast, land-use planning focuses on the sustainable development of multi-functional landscapes. In this human-centred perspective, land parcel ownership and administrative boundaries define the relevant spatial scale and the degree to which landscape development can be influenced by policy, which in the case of Alberta includes the introduction of ecosystem services and biodiversity markets that play a major role in balancing environmental considerations with socio-economic drivers59. Regarding landscape connectivity, the focus thus lies on how human landscape alteration affects the connectivity of the remaining natural heritage system and how to compare the expected effect of local development alternatives on larger-scale connectivity. This focus is highly compatible with the modelling of connectivity based on human modification, which will result in a model of structural landscape connectivity.
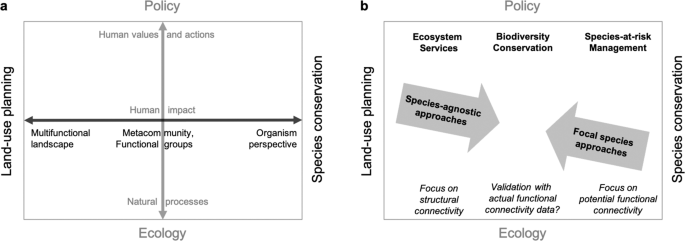
Conceptual framework: different perspectives on the landscape (a) and corresponding goals and approaches to connectivity modelling (b). The horizontal axis (black) illustrates how the landscape definition shifts from a multi-functional landscape in the context of land-use planning to an organism perspective in the context of species conservation. The vertical axis (grey) illustrates how the focus shifts from natural processes in basic ecology to human values and actions in a policy context. These values are reflected in policy that aims to preserve ecosystem services, biodiversity in general, or designated species of concern. Species-agnostic modelling of landscape connectivity may be most suitable in a land-use planning context, whereas focal species approaches may be most suitable in a conservation management context. When biodiversity data are available for many taxa, multi-species overlay can also be an efficient option to model connectivity for land-use planning and conservation programs for a representative suite of species. Validation of structural connectivity or potential functional connectivity based models could also be done with appropriate biological data, to assess actual functional connectivity.
A coarse-filter approach to biodiversity conservation management falls somewhere in-between61,62. The focus in this approach lies on preserving a community, such as grassland, wetland, or forest interior species, by maintaining a sufficient amount, quality, and connectivity of the respective ecosystem in the landscape. This implies that the species within a community have similar needs and characteristics, including their ability to move between habitat patches. Regarding landscape connectivity, we suggest that species-level data, such as mark-recapture, radio-telemetry, and molecular genetics data, which provide a direct measure of actual functional connectivity, may be used to test and compare species-agnostic (top-down) or multi-species (bottom-up) connectivity models. At the community-level, however, data such as biodiversity monitoring that is systematically collected across a large geographic area can be used as indirect measures of functional connectivity. If a connectivity model can explain, e.g., variation in species composition that remains unexplained by local site characteristics, this may indicate that it successfully captured the shared response of a broad range of species to human landscape modification. Note that there is a lack of empirical studies that compare a general-use connectivity assessment based on the overlay of many species-specific models across taxonomic groups to a species-agnostic model.
Another distinction occurs along the vertical axis in Fig. 1a: while ecology primarily considers natural processes, policy addresses human values and actions. The two perspectives meet in the consideration of the human impact on ecosystems. Based on this framework, a species-agnostic approach to modelling landscape connectivity quantifies how human actions and their manifestation as non-natural landscape features constrain ecological flow across the underlying natural fabric of the landscape. The main goals of this approach are to identify critical linkages and to support the evaluation of alternative development scenarios, with the general aim of maintaining ecosystem services and biodiversity in the context of sustainable development. This cannot replace fine-filter approaches for specific conservation goals, such as species-at-risk management. Note also that ecosystems can have an impact on humans as well, such as the spread of animal-transmitted diseases (e.g., West-Nile virus or Lyme disease). Here, we focus on human impacts on natural ecosystems.
To implement a species-agnostic approach, resistance values are assigned to non-natural landscape features based on expert opinion33. Conceptually, this involves two steps: (1) quantifying the degree of human modification, and (2) using a scaling function to assign resistance values based on the degree of human modification. We argue that beyond an inevitable element of subjectivity in expert-defined values, different interpretations of what constitutes degree of human modification can result in considerable differences between values. For instance, two types of roads may have the same physical footprint in terms of deviation from natural conditions (impermeable surface) but differ vastly in their intensity of use (traffic volume), which will affect e.g. road mortality rates. The relative scaling of resistance values is known to have a large effect on connectivity modelling, and a sharp contrast between low, medium or high resistance values has previously been suggested and used34,38,39.
In addition to human modification, some authors including Dickson et al.34 also considered natural barriers to the movement of terrestrial organisms and applied resistance values to features like water bodies and topography. Conceptually, this introduced an element of potential functional connectivity as it makes assumptions about the movement ability of organisms. In practice, this raises the concern that, e.g., water bodies may be traversable for some terrestrial species but not for others. Specifically, water bodies are a special case in such a framework as they are not a terrestrial feature, and while they are mostly natural, some authors have treated them as a barrier. However, in the context of species-agnostic models, much less thought has been given to the decision how to conceptualize water bodies than to other factors.
Here, we define a conceptually justified range of variation for the three factors identified above, with the goal of directly comparing their relative importance, as they have been addressed independently in previous studies on species-agnostic connectivity modelling: (i) the assignment of degree of human modification values by degree of deviation from natural conditions (footprint) or by the intensity of use; (ii) the assignment of resistance value to water bodies between minimum (natural) and a value close to the maximum of all human features combined (near-complete barrier); and (iii) the choice of scaling function resulting in a weak or strong contrast between non-natural and natural landscape features. We use intermediate values33 to create the main map, and we assess uncertainty in a factorial design using the extremes of each factor.
Circuit theory models connectivity as current density, where areas with high current density are interpreted as contributing to larger-scale landscape connectivity and thus ‘ecological flow’ across the study area32,42. We thus assess the contribution of each factor to variation among maps in the quantification of current density as the contribution of a cell to large-scale connectivity. We argue that visual interpretation of current density maps is affected by the choice of colour ramp, which should reflect a conscious decision about how cells with important contribution to large-scale connectivity (high current density values) are identified. J. Bowman (Trent University, pers. comm.) suggested that visualizing and interpreting current density values that have values higher than one standard deviation above the map mean (i.e., z scores> 1) as contributing areas provides a good balance for application. Here, we further vary this cut-off between the mean (i.e., z scores> 0) and two standard deviations above the mean (i.e., z scores> 2) to assess whether the uncertainty related to the factors above varies with the cut-off level used.
Results
The main map (Fig. 2) shows prominent connectivity pathways extending mainly from the southwest to the northeast of Alberta. More specifically, areas of high current density are concentrated in the foothill region, connecting the Rocky Mountain range to the forest-dominated northern part of the province. Patterns of high current density were also observed in the south-eastern grassland and in the north-eastern Canadian Shield region of the province.

Main map computation pipeline. Main map was calculated using an average combination (HFU) of physical human footprint, HF, and intensity of human use, HU, resistance values. Map (a) shows resistance map calculated at 100 m resolution where darker values represent high resistance and brighter values represent lower resistance (red dots, nodes used to compute the following current density map). The map was computed in R 3.4.283 and QuantumGIS80. Map (b) is the current density map resulting from GFlow’s49 electric current simulation at a 100 m resolution. Red to yellow colour ramp represents higher values of current density while darker purple to blue colour ramp represents lower values of current density. Map (c) is clipped to Alberta extent and current density values were standardized and centred at a 100 m resolution. Hot colour ramp represents important connectivity cells with a z > 0, and grey scale colour ramp represents unimportant connectivity cells with z < 0. The map was computed in R 3.4.283.
The uncertainty analysis showed large variations in absolute current density values among maps, both in their ranges (Table 1) and distributions (Fig. 3). Differences in the shape of distribution of current density values were most pronounced for values below the mean. The proportion of cells with z > 1 (or z > 2) was quite constant, but more variable for cells with z > 0 (Fig. 3). These variations resulted in different patterns of high current flow pathways between maps (Fig. 4).

Cell distribution following their scaled (with mean = 0) current density in the four HF maps (dark grey), the four HU maps (white), and the main, HFU map (light grey). Violin plot width is proportional to cell density. The boxplots show median and quartiles of each distribution. The z-score cut-offs are represented as horizontal lines: z = 0 (solid), 1 (dashed), and 2 (dotted).

Variance partitioning analysis depicting relative contribution of each choice factor: H index (either HF or HU; black); water resistance (either 0 or 1000; dark grey); and scaling function (either linear or derived power; light grey). Analysis was done separately for each z-score cut-off used to identify important cells, (either z = 0, 1, or 2) and for the cell-by-cell correlations in current density values between maps (Cor). Variances are presented as percentages (%).
Cell-by-cell correlations in current density values between maps indicated a wide range in concordance between maps varying from a minimum correlation of r = 0.34 to 0.94 (Table 2). Redundancy analysis showed that map correlations were most affected by differences in water resistance and scaling function (42.4% and 28.4% of variance explained, respectively; Figs. 4 and 5). In contrast, variation in the H index used (HF vs. HU) only explained 12.5% of the variation and 16.7% of variation among maps could not be explained by marginal effects. Such unexplained variation could be related to specific combinations of factor levels (i.e., interactions) or random variation, e.g., due to random selection of pairs of nodes.

Scaled (with mean = 0) current density maps of Alberta at 100 × 100 m resolution using either HF (a–d) or HU (e–h) as human modification index. H index was considered in combination with: minimum water resistance and maximum scaling (a,e); maximum water resistance and maximum scaling (b,f); maximum water resistance and minimum scaling (c,g); and minimum water resistance and minimum scaling (d,h). Hot colour ramp represents important connectivity cells with z > 0, and grey scale colour ramp represents unimportant connectivity cells with z < 0. Maps were computed using GFlow49.
When using a cut-off (z ≥ 0, 1, or 2) to classify cells as important or unimportant for connectivity based on the z-score of their current density value, a similar pattern emerged. However, consistencies between map classifications were more affected by scaling function (39.4–47.8%) than water resistance (28.6–33.1%). The effect of variation in the H index was considerably smaller, increasing from 1.8% for z ≥ 0 to 3.7% for z ≥ 2, whereas the proportion of variation unexplained by marginal effects was larger (21.8–27.8%).
Qualitative interpretation of the correlation matrix in Table 2 suggests considerable interactions between factors (which we did not formally include in the db-RDA model to avoid over fitting). For pairs of maps with the same water resistance level, the differences between HF and HU maps were more pronounced with the high-contrast scaling (correlation r = 0.78 and 0.79) than for the low-contrast scaling (r = 0.94). With high-contrast scaling, the effect of water was more pronounced when using the HU index (r = 0.54) than when using the HF index (r = 0.73). With low-contrast scaling, water resistance had a smaller impact on the maps (r = 0.85), irrespective of the choice of H index.
Discussion
We presented a conceptual framework for species-agnostic connectivity modelling (Fig. 1) and applied it to model connectivity as current density across the entire province of Alberta, Canada. We assessed the effect of conceptual and computational decisions involved in implementing the approach, and provided a much-needed direct comparison of the degree of uncertainty related to these decisions. First, we examined the effect of the conceptualization of human modification (H index) represented by the degree of physical footprint HF and the intensity of human use HU on current density maps. Second, we analysed the impact of the scaling function that was used to convert H values to resistance, and therefore the contrast between cells with low, intermediate, or high degrees of human modification in their ability to constrain current flow. Thirdly, we assessed the effect of the conceptualization of water bodies as a near-complete barrier on the resulting current density maps. Lastly, we evaluated whether the sensitivity of current density maps to these three parameters is affected by the cut-off threshold used to identify cells that contribute to larger-scale connectivity. We discuss the importance of these factors in an applied land-use planning context.
Since resistance values commonly rely on arbitrary definition by expert opinion, connectivity modelling is often criticized for human decision bias that might affect the resulting maps23. In a species-specific approach, expert opinion can be based on a thorough understanding of the life history and ecology of the focal species (e.g.21), but key parameters may be unknown or incorrectly assessed. While new optimization methods have been proposed for fitting resistance values based on measures of actual functional connectivity, such as molecular genetic data for a focal species41, inference of resistance values has been shown to vary between landscapes even for a single species63. The species-agnostic approach relies on the assumption that ecological flow is negatively related to degree of human modification, though this concept is often vaguely defined and may include many dimensions of human modifications. In our study, we conceptualized the degree of human modification for each human-footprint category using two independent parameters, the degree of physical human footprint (HF) and the intensity of its use (HU). An expert panel defined both sets of values, separately for the forest- and agriculture-dominated areas of Alberta. In line with the land-use planning perspective of a species-agnostic modelling of landscape connectivity (Fig. 1b), the assigned values reflect expert consensus about degree of human modification, and not resistance to organismal movement. We believe that such conceptual clarity is important as it makes species-agnostic models more transparent and better justifiable. For the main map, we then used the mean of the two indices HF and HU. Despite differences in quantitative and relative values of human modifications attributed to human-footprint categories, we found that the resulting current density maps showed limited sensitivity to these variations. Pairwise correlations between maps (based on cell-by-cell current density values) showed a moderate degree of variation between HF and HU maps with high-contrast scaling. When a cut-off was used to identify cells that contribute to larger-scale connectivity, however, there was a high degree of consistency between maps. This suggests that the differences may be largely due to variation in the lower end of the distribution of current density values, where we found considerable differences in the shape of distributions (Fig. 3). From an applied perspective, consistency in the upper tail (identification of areas important for larger-scale connectivity) arguably is more important than minor distinctions among areas that contribute relatively little to larger-scale connectivity.
As expected from the literature38,39, the scaling method had a major impact on current density maps. We found that a high-contrast scaling amplified the effect of other parameter settings (water resistance, H index). High-contrast scaling function increased sensitivity to conceptual decisions regarding the constraining effect of human landscape alterations and topographic features. Such sensitivity is not necessarily bad; rather, large contrasts may be required to effectively model constraints on connectivity. For instance, Koen et al.28 assigned resistance values of {10, 100, 1000} to natural, unnatural but permeable to movement, and unnatural impermeable land cover types, and successfully validated their current density map for South-eastern Ontario with road mortality data for 20 reptile and amphibian species and with radio-telemetry data for fishers (Pekania [Martes] pennanti). As a preliminary step in their study, Dickson et al.34 compared the impact of different scaling functions on the relative distribution of resistance values (R), e.g., by varying the exponent in Eq. 2a. They concluded that small exponents produced exaggerated resistance values for land-use classes with low to intermediate degrees of human modification, and that an exponent of 10 better matched their expectations (Eq. 2a). We used the function used by Dickson et al.34 in Eqs. 2a and 2b as an upper limit of the range to be considered (high contrast scaling), and we used it for the main map. This scaling gives much more weight to high H values than intermediate or low values: for H = {0, 0.5, 1}, the function (H = 1)10 returns the values {1, 57.7, 1024}, with slightly more contrast than Koen et al.38. We used the linear function in Eq. 2c as a conservative lower limit of scaling functions (low contrast scaling), as it does not affect the relative position of resistance values among human-footprint categories: for H = {0, 0.5, 1}, the function (1 + H *1000) returns the values {1, 501, 1001}.
Connectivity modelling requires a careful consideration of not only humanmodification type and degree of intensity, but also of natural landscape features that could form potential barriers to movement. We largely followed Dickson et al.34 in assigning resistance values for water bodies and slope, and Koen et al.28 likewise treated the resistance of water bodies as barriers equivalent to impermeable non-natural landscape features. However, this is a move away from the conceptually ‘clean’ modelling of landscape connectivity as a function of human modification. Assigning resistance values to natural landscape features implies assumptions about organism movement ability and thus a taxonomic reference. Inevitably, examples can be found where a natural topographic feature may act as a barrier for one species but not for another, thus crossing over from a pure species-agnostic approach to an implicitly multi-species approach (Fig. 1).
Our sensitivity analysis showed a very large effect of the resistance value attributed to water on the resulting current density maps. Based on pairwise correlations between maps, the variation due to resistance to water was considerably larger than the variation due to scaling function. (Note that we did not vary the parameters for resistance due to slope, but its range is more limited, where a slope of 100% results in an increase of resistance values by 25 only). Given the magnitude of the effect of water resistance, the lack of awareness of its importance in previous studies is surprising. For the main map, we thus deviated from Dickson et al.34 and used an intermediate resistance value for water.
Studies that apply circuit theory to model landscape connectivity are lacking an agreement on a cut-off to distinguish cells that are contributing to the large-scale connectivity. In our study we explored the sensitivity of our maps to the change in three cut-offs represented as z-scores for standardized current density values. The shape of the lower tail of the distribution of current density values varied considerably between maps. The proportion of cells with standardized current density values of z > 1 (or z > 2), however, was relatively constant, but more variable for cells with z > 0. Map comparison with db-RDA showed that overall, cell classification was surprisingly robust to the definition of human modification (HF vs. HU), which becomes slightly more important at higher cut-offs. Taken together, these results indicate that a cut-off of z > 1, as suggested by Bowman (pers. comm.), may be a robust threshold for identifying cells that are contributing to connectivity.
Species-agnostic approaches for modelling landscape connectivity have been criticized mainly for not being based on species traits. We argue that the power of such species-agnostic connectivity models relies on their generality and direct link to multifunctional land-use planning, as H values are assigned to policy-relevant human-footprint categories28. As we indicated in our conceptual framework, species-agnostic models are not meant to replace species-specific models designed explicitly to serve specific conservational goals, such as species-at-risk management. It is important to acknowledge that even the use of a species-agnostic model implies assumptions about organismal movement, albeit in a generalized way. The decision of how to treat natural elements like water or slope has been discussed above. An implicit assumption is also that human landscape features affect most species in a similar way. However, examples from the literature indicate, e.g., that some species may actively use roads as corridors, whereas for other species, forest may impede movement64. Acceptance of species-agnostic models of landscape connectivity will likely depend on validation with independent ecological data, as successfully performed by Koen et al.28 for a limited set of species and at a smaller spatial scale. While testing the different models is beyond the scope of the present paper, we plan to use the unique biodiversity monitoring data (with 1656 sites spaced 20 km across Alberta; ABMI) and derived species-level distribution models available through the ABMI to test our connectivity maps. This could be done by assessing which proportion of species turnover across large taxonomic and functional groups can be explained by the current density (i.e., value of being near a “biodiversity highway”) that cannot be explained by current species distribution models based on local site conditions and composition-based landscape metrics (including habitat amount). More research is needed to empirically compare the performance of top-down vs. bottom-up connectivity modelling for land-use planning purposes, i.e., to ascertain whether overlaying many species-specific models would result in a substantially different general-use connectivity assessment than species agnostic models.
The main goal of a large-scale connectivity map is to identify and visualize ‘biodiversity highways’, or important routes of ecological flow. Note that a large-scale connectivity map is not designed to evaluate connectivity in a network of patches (e.g., a natural heritage system). To evaluate connectivity between two specific patches, considering all possible movement paths by using current density, nodes would have to be placed in the two patches42. In a network model, it is possible to quantify the contribution of each patch or link to overall probability of connectivity65,66. However, this should not be done based on current density, as such network analysis aims to distinguish between alternative paths, and hence least cost path distances are better suited for this goal. Linkages between pairs of patches can then be modelled probabilistically based on assumptions about organism’s dispersal ability50.
Large-scale, high-resolution modelling of current density remains a computational challenge, despite the new, computationally efficient implementation of Circuitscape in Julia52 or the alternative implementation in GFlow49. Using GFlow on the Niagara supercomputing facility (SciNet HPC Consortium), we still encountered technical limitations that prevented us from modelling current density at a spatial resolution below 100 m across the province. We calculated resistance values at a high-resolution of 10 m to minimize artefacts related to rasterisation of linear features67,68. However, the barrier effect of linear features likely was dampened by aggregating resistance within 100 m cells prior to current density modelling.
Land-cover changes due to human activities and climate change are main drivers of land-use planning, and their study is the basis of land system science (as defined in Verburg et al.69). This discipline focuses on both the drivers and impacts of land-use change as part of global change. Land systems also offer solutions to global change through adaptation and mitigation and can play a key role in achieving a sustainable future for Earth. Recent studies propose to incorporate landscape ecology issues when designing land systems to understand how and why governance impacts human land change decisions and how those land change patterns influence, and are affected by, the underlying ecological processes (e.g.,70). Species-agnostic connectivity modelling based on human modification provides a powerful tool in evaluating the effect of human decisions and actions on multi-level ecological processes and dynamics and simulating the effect of alternative future scenarios.
Methods
Study area
Our study area, Alberta, is a western Canadian province bordered by British Columbia to the west, Saskatchewan to the east, the Northwest Territories to the north, and Montana (USA) to the south (Fig. 6a). We divided Alberta into two regions (Fig. 6). The forest-dominated area (61% of area), which includes the northern half of the province and the Rocky Mountain area, is mostly covered by native and managed boreal forest and contains most Crown lands and public lands. The agriculture-dominated area (39% of area), which includes the southern half and the central-western part of the province, is dominated by agricultural lands and grasslands and includes most of the urban areas.

(a) Map of the study area encompassing the province of Alberta and neighbouring Canadian Provinces and Territory and US States intersecting with the buffer area (rounded black line surrounding Alberta) around the province. Are represented the forest- (green) and agriculture-dominated (white) areas in Alberta, for which H values were allowed to be different for each human-footprint category. (b) Delineation of the main natural eco-regions in Alberta.
Spatial human footprint data
To map landscape structural connectivity in Alberta as current density, we used ABMI’s Human Footprint Inventory (HFI) derived from the detailed 2014 land-use dataset (for complete information on data collection and computation of the land-use geodatabase, see Geospatial Centre ABMI, 2018). This dataset was derived from 2014 SPOT6 Satellite Imagery (1.5 m Color SPOT 6 Mosaic) provided by Alberta Environment and Sustainable Resource Development, Informatics Branch (https://www.alberta.ca/environment-and-parks.aspx). The original geodatabase consisted of 21 polygon-based layers including 115 land-uses grouped into 6 main categories: agricultural, forestry, transportation, urban, energy, and human-created water bodies71.
To avoid boundary effects72, we mapped human footprints in a buffer zone surrounding Alberta, using several datasets collected at the federal levels of Canada and the USA. Land cover in the Canadian buffer zone was mapped using raster thematic data originating from classified Landsat 5 and Landsat 7 ortho-images circa 2010 (resolution: 30 meters)73. The physical footprint of roads and railways in the Canadian part of the buffer zone was mapped using the National Road and Railways Network databases74,75. Land cover in the USA buffer zone was characterized using the National Land Cover Database 2011 for the conterminous United States (NLCD76; www.mrlc.gov). The physical footprint of roads and railways in the USA was mapped using TIGER 2014 data (http://www.census.gov/geo/maps-data/data/tiger-line.html). After homogenizing and grouping variables for each dataset, we retained 84 human-footprint categories in total, with 66 categories for Alberta, 8 for the Canadian buffer zone, and 10 for the USA (Appendix 1).
Mapping landscape resistance
We modified the methodology by Theobald33 and Dickson et al.34 to map landscape resistance and connectivity across Alberta based on the degree of human modification, H. At a given location, H is the sum of the individual degrees of human modifications h caused by all human-footprints at this location33. As a major modification of the method, the value of H attributed to each human-footprint was conceptualized as the combination of two parameters: degree of physical footprint and intensity of human use (Appendix 1). Values of degree of footprint HF were based on the degree of change from the native state and the degree of modification. Values of intensity of human use (HU) were based on the assumed average of the amount of human passage, presence, and density throughout the year. HF and HU values were assigned summarily to each human-footprint category (not, e.g., for individual roads) and were allowed to differ between the forest- and agriculture-dominated areas of the province (Appendix 1). Both the HF and HU indices were calculated on a scale from 0.0 (low footprint, low human use, respectively) to 1.0 (high footprint, high human use, respectively). Values of HF and HU indices were assigned based on expert opinion of the Alberta Human Footprint Technical Committee (Alberta Human Footprint Mapping Program). We explicitly asked the experts to focus on the degree of physical footprint and intensity of human use, respectively, without any consideration of particular taxa and their relation with considered human-footprints. The main, average map was calculated as the mean between HF and HU indices, hereafter referred to as HFU, whereas for the sensitivity analysis, we used maps with either HF or HU but not both.
For each human-footprint j (n = 84) separately, we attributed an individual value of either 1 or 0 to each 10 × 10 m cell of a raster grid covering the study area, depending on whether or not the cell overlapped with polygons of the considered human-footprint category. We then applied human modification values hj according to Table 1, separately for HF, HU, or HFU, to cells of value 1. Finally, we combined the 84 layers hj into a single, overall metric of the degree of human modification H, separately for HF, HU, and HFU. In the absence of human footprint, we used a value of h = 0. When a cell was impacted by multiple human footprints j, we assumed that it should have a higher degree of human modification than a cell with a single human-footprint33. We used the fuzzy algebraic sum77 for which the result is always at least as large as the largest contributing factor, so that the effect is additive, but never exceeds 133. The degree of human modification Hi at each cell i was then calculated, separately for each HF, HU, and HFU, as:
where hj is the degree of modification for an individual human-footprint layer j (for j = 1…k).
Dickson et al.34 derived resistance values R by rescaling H values with a scaling function and adding resistance values for areas with steep slopes s and for water bodies w (in their case, major rivers), to account for their possible constraining effect on organismal movement:
In this equation, the maximum resistance due to H is (1 + 1)10 = 1024, a slope percentage of s = 100 carries a penalty of 100/4 = 25, and a water body (w = 1) carries a penalty of 1000, which corresponds to a value of H = 0.999 (Note that in the rare case of a cell with intensive human modification (H = 1) and water body (w = 1), the total resistance could technically reach a value of up to 2024). Percent slope s was derived from the US National Elevation Dataset for the entire study area78.
We modified Eq. 2a for the main map to assign water bodies a lower resistance value of 57.7, which corresponds to an intermediate value of HFU = 0.5 (Eq. 2b):
For the sensitivity analysis, we independently varied the H index (HF or HU), the scaling function, and resistance of water bodies in Eq. 2a as shown in Table 3, resulting in eight combinations. Raising (H + 1) to the power of 10 results in a very strong contrast between natural and non-natural landscape features34. As a low-contrast alternative, we used a linear scaling function, (1 + H * 1000), which preserves the proportional importance of human modification values. This means that for instance, resistance values R based on HF with low-contrast scaling of H and low resistance of water bodies w were calculated as:
Because of computational limitations, we aggregated the 10 × 10 m resolution resistance layers R to 100 × 100 m resolution before assessing current density. Cells were aggregated using the mean resistance value of combined 10 × 10 m cells (aggregate function in R, raster package79).
General procedure for current density computation
We derived a current density map from each resistance map R at the 100 × 100 m resolution using GFlow49. GFlow is a new software which parallelizes the computation of circuit theory42 and allows for simultaneous large-extent and fine-grained connectivity modelling.
We simulated current density between pairs of points (nodes) randomly chosen at each iteration among 50 points that were evenly distributed (approx. every 100 km) along the outer margin of the buffer zone (Fig. 6). This methodology reduces node location bias compared to randomly selecting nodes within the study area and requires fewer pairwise computations28. A buffer zone with a linear width of at least 20% of the width of the study area has been shown to be sufficient to remove the effects of node placement on current density28. We used the “Buffer by Percentage” plugin in QuantumGIS80 with a setting of 250% to ensure a sufficient buffer size around Alberta’s polygon (Fig. 6).
To ensure that we considered a sufficient number of random pairs of nodes to converge upon a solution, we set the convergence factor implemented in GFlow (correlation function) to 3 N (=0.999). The convergence value is calculated for each pairwise solve (i.e., iteration) and ranges from 0 to 1. With an increasing number of iterations, the current density maps converge, so that additional connections have a marginally small effect on the result. When the convergence threshold is reached, the computation stops and the current density map is completed49. As a final step, we removed the buffer zone to only keep Alberta’s extent.
Map comparison and evaluation of the uncertainty
We standardized current density values as z-scores (z = \(\bar{x}\)/sd) by subtracting the mean value \(\bar{x}\), and dividing by the standard deviation sd. We used three different thresholds (z ≥ 0, 1, or 2) for identifying cells with important contribution to connectivity. We assessed the relative contribution of the three factors listed in Appendix 1 to the variance between current density maps in a factorial design with variation partitioning using distance-based redundancy analysis (db-RDA81). First, we derived an 8 × 8 correlation matrix by calculating the Pearson correlation r between each pair of maps. For each of the three cut-off levels, we derived an 8 × 8 similarity matrix by counting, for each pair of maps, the proportion of cells that were classified the same way (either as ‘important’ or as ‘unimportant’ in both maps). All four matrices were converted to dissimilarity matrices. For each dissimilarity matrix, we performed a db-RDA82 where the three explanatory factors (H index, scaling function, and water resistance) were coded as dummy variables. We used the function varpart in the R package vegan to obtain adjusted R2 values for the contribution of each factor.
Unless otherwise stated, all computations and analyses were performed in R 3.4.283 on Niagara supercomputer at the SciNet HPC Consortium.
Data availability
The full human-footprint dataset of Alberta can be found at https://abmi.ca/home/data-analytics. Dataset and R script used for the ANOVA / statistical analysis is available at https://doi.org/10.5683/SP2/KJVW8Y.
References
Foley, J. A. et al. Global consequences of land use. Science 309, 570–574 (2005).
Newbold, T. et al. Global effects of land use on local terrestrial biodiversity. Nature 520, 45–50 (2015).
IPCC. Climate Change 2014–Impacts, Adaptation and Vulnerability: Regional Aspects. (Cambridge University Press, 2014).
Vörösmarty, C. J., Green, P., Salisbury, J. & Lammers, R. B. Global water resources: vulnerability from climate change and population growth. science 289, 284–288 (2000).
Beelen, R. et al. Development of NO2 and NOx land use regression models for estimating air pollution exposure in 36 study areas in Europe – The ESCAPE project. Atmos. Environ. 72, 10–23 (2013).
Bennett, E. M., Carpenter, S. R. & Caraco, N. F. Human Impact on Erodable Phosphorus and Eutrophication: A Global Perspective: Increasing accumulation of phosphorus in soil threatens rivers, lakes, and coastal oceans with eutrophication. BioScience 51, 227–234 (2001).
Smith, P. et al. Global change pressures on soils from land use and management. Glob. Change Biol. 22, 1008–1028 (2016).
Seiferling, I., Proulx, R. & Wirth, C. Disentangling the environmental-heterogeneity–species-diversity relationship along a gradient of human footprint. Ecology 95, 2084–2095 (2014).
Forman, R. T. Some general principles of landscape and regional ecology. Landsc. Ecol. 10, 133–142 (1995).
Leonard, P. B. et al. Landscape connectivity losses due to sea level rise and land use change. Anim. Conserv. 20, 80–90 (2017).
Taylor, P. D., Fahrig, L., Henein, K. & Merriam, G. Connectivity is a vital element of landscape structure. Oikos 571–573 (1993).
Tischendorf, L. & Fahrig, L. On the usage and measurement of landscape connectivity. Oikos 90, 7–19 (2000).
Calabrese, J. M. & Fagan, W. F. A comparison-shopper’s guide to connectivity metrics. Front. Ecol. Environ. 2, 529–536 (2004).
Ricotta, C., Stanisci, A., Avena, G. C. & Blasi, C. Quantifying the network connectivity of landscape mosaics: a graph-theoretical approach. Community Ecol. 1, 89–94 (2000).
Fahrig, L. & Merriam, G. Habitat patch connectivity and population survival. Ecology 66, 1762–1768 (1985).
Kramer-Schadt, S., Revilla, E., Wiegand, T. & Breitenmoser, U. R. S. Fragmented landscapes, road mortality and patch connectivity: modelling influences on the dispersal of Eurasian lynx. J. Appl. Ecol. 41, 711–723 (2004).
Mitchell, M. G. E. et al. Reframing landscape fragmentation’s effects on ecosystem services. Trends Ecol. Evol. 30, 190–198 (2015).
Lechner, A. M., Brown, G. & Raymond, C. M. Modeling the impact of future development and public conservation orientation on landscape connectivity for conservation planning. Landsc. Ecol. 30, 699–713 (2015).
Lindenmayer, D. B. & Fischer, J. Habitat fragmentation and landscape change: an ecological and conservation synthesis. (Island Press, 2013).
Krosby, M. et al. Focal species and landscape “naturalness” corridor models offer complementary approaches for connectivity conservation planning. Landsc. Ecol. 30, 2121–2132 (2015).
Reed, G. C. et al. Modeling landscape connectivity for bobcats using expert‐opinion and empirically derived models: how well do they work? Anim. Conserv. 20, 308–320 (2017).
Albert, C. H., Rayfield, B., Dumitru, M. & Gonzalez, A. Applying network theory to prioritize multispecies habitat networks that are robust to climate and land‐use change. Conserv. Biol. 31, 1383–1396 (2017).
Zeller, K. A., McGarigal, K. & Whiteley, A. R. Estimating landscape resistance to movement: a review. Landsc. Ecol. 27, 777–797 (2012).
Adriaensen, F. et al. The application of ‘least-cost’modelling as a functional landscape model. Landsc. Urban Plan. 64, 233–247 (2003).
Fahrig, L. Ecological responses to habitat fragmentation per se. Annu. Rev. Ecol. Evol. Syst. 48, 1–23 (2017).
Fletcher, R. J., Burrell, N. S., Reichert, B. E., Vasudev, D. & Austin, J. D. Divergent perspectives on landscape connectivity reveal consistent effects from genes to communities. Curr. Landsc. Ecol. Rep. 1, 67–79 (2016).
Chetkiewicz, C.-L. B., St. Clair, C. C. & Boyce, M. S. Corridors for conservation: integrating pattern and process. Annu Rev Ecol Evol Syst 37, 317–342 (2006).
Koen, E. L., Bowman, J., Sadowski, C. & Walpole, A. A. Landscape connectivity for wildlife: development and validation of multispecies linkage maps. Methods Ecol. Evol. 5, 626–633 (2014).
Theobald, D. M., Reed, S. E., Fields, K. & Soule, M. Connecting natural landscapes using a landscape permeability model to prioritize conservation activities in the United States. Conserv. Lett. 5, 123–133 (2012).
Jaeger, J. A. Landscape division, splitting index, and effective mesh size: new measures of landscape fragmentation. Landsc. Ecol. 15, 115–130 (2000).
Jaeger, J. A. Effects of the configuration of road networks on landscape connectivity. (2007).
Dickson, B. G. et al. Circuit-theory applications to connectivity science and conservation. Conserv. Biol. 33, 239–249 (2019).
Theobald, D. M. A general model to quantify ecological integrity for landscape assessments and US application. Landsc. Ecol. 28, 1859–1874 (2013).
Dickson, B. G. et al. Informing strategic efforts to expand and connect protected areas using a model of ecological flow, with application to the western United States. Conserv. Lett. 10, 564–571 (2017).
Beier, P., Majka, D. R. & Newell, S. L. Uncertainty analysis of least-cost modeling for designing wildlife linkages. Ecol. Appl. 19, 2067–2077 (2009).
Sawyer, S. C., Epps, C. W. & Brashares, J. S. Placing linkages among fragmented habitats: do least‐cost models reflect how animals use landscapes? J. Appl. Ecol. 48, 668–678 (2011).
Simpkins, C. E., Dennis, T. E., Etherington, T. R. & Perry, G. L. Effects of uncertain cost-surface specification on landscape connectivity measures. Ecol. Inform. 38, 1–11 (2017).
Koen, E. L., Bowman, J. & Walpole, A. A. The effect of cost surface parameterization on landscape resistance estimates. Mol. Ecol. Resour. 12, 686–696 (2012).
Rayfield, B., Fortin, M.-J. & Fall, A. The sensitivity of least-cost habitat graphs to relative cost surface values. Landsc. Ecol. 25, 519–532 (2010).
Arponen, A., Lehtomäki, J., Leppänen, J., Tomppo, E. & Moilanen, A. Effects of connectivity and spatial resolution of analyses on conservation prioritization across large extents. Conserv. Biol. 26, 294–304 (2012).
Peterman, W. E. ResistanceGA: An R package for the optimization of resistance surfaces using genetic algorithms. Methods Ecol. Evol. 9, 1638–1647 (2018).
McRae, B. H., Dickson, B. G., Keitt, T. H. & Shah, V. B. Using circuit theory to model connectivity in ecology. evolution, and conservation. Ecology 89, 2712–2724 (2008).
Kool, J. T., Moilanen, A. & Treml, E. A. Population connectivity: recent advances and new perspectives. Landsc. Ecol. 28, 165–185 (2013).
Ferreras, P. Landscape structure and asymmetrical inter-patch connectivity in a metapopulation of the endangered Iberian lynx. Biol. Conserv. 100, 125–136 (2001).
Kuhnert, M., Voinov, A. & Seppelt, R. Comparing raster map comparison algorithms for spatial modeling and analysis. Photogramm. Eng. Remote Sens. 71, 975–984 (2005).
Šímová, P. & Gdulová, K. Landscape indices behavior: a review of scale effects. Appl. Geogr. 34, 385–394 (2012).
Wu, J. Effects of changing scale on landscape pattern analysis: scaling relations. Landsc. Ecol. 19, 125–138 (2004).
Cushman, S. A. & Landguth, E. L. Scale dependent inference in landscape genetics. Landsc. Ecol. 25, 967–979 (2010).
Leonard, P. B. et al. gflow: software for modelling circuit theory-based connectivity at any scale. Methods Ecol. Evol. 8, 519–526 (2017).
Saura, S., Estreguil, C., Mouton, C. & Rodríguez-Freire, M. Network analysis to assess landscape connectivity trends: application to European forests (1990–2000). Ecol. Indic. 11, 407–416 (2011).
Pelletier, D. et al. Applying circuit theory for corridor expansion and management at regional scales: tiling, pinch points, and omnidirectional connectivity. Plos One 9, e84135 (2014).
McRae, B. H., Shah, V. B. & Mohapatra, T. K. Circuitscape 4 User Guide. (2013).
Alberta Innovates. Ecosystem Services Roadmap - Proof of Concept. (2014).
Sólymos, P. et al. Data and information management for the monitoring of biodiversity in Alberta. Wildl. Soc. Bull. 39, 472–479 (2015).
Government of Alberta. Alberta Economy. http://www.albertacanada.com/business/overview/economic-results.aspx (2017).
Ruan, X., Qiu, F. & Dyck, M. The effects of environmental and socioeconomic factors on land-use changes: a study of Alberta, Canada. Environ. Monit. Assess. 188, 1–31 (2016).
Carew, R., Florkowski, W. J. & Zhang, Y. Industry levy-funded pulse crop research in Canada: Evidence from the prairie provinces. Can. J. Plant Sci. 93, 1017–1028 (2013).
Haarsma, D. & Qiu, F. Assessing neighbor and population growth influences on agricultural land conversion. Appl. Spat. Anal. Policy 10, 21–41 (2017).
Government of Alberta. Land-use Framework. (2008).
Wiens, J. A. Spatial scaling in ecology. Funct. Ecol. 3, 385–397 (1989).
Haufler, J. B., Mehl, C. A. & Roloff, G. J. Using a coarse-filter approach with species assessment for ecosystem management. Wildl. Soc. 24, 200–208 (1996).
Hunter, M. L. J. Coping with ignorance: the coarse-filter strategy for maintaining biodiversity. In Balancing On the Brink of Extinction (ed. Kohm, K. A.) 266–281 (Island Press, 1991).
Short Bull, R. A. et al. Why replication is important in landscape genetics: American black bear in the Rocky Mountains. Mol. Ecol. 20, 1092–1107 (2011).
Villemey, A. et al. Can linear transportation infrastructure verges constitute a habitat and/or a corridor for insects in temperate landscapes? A systematic review. Environ. Evid. 7, 5 (2018).
Pascual-Hortal, L. & Saura, S. Comparison and development of new graph-based landscape connectivity indices: towards the priorization of habitat patches and corridors for conservation. Landsc. Ecol. 21, 959–967 (2006).
Saura, S. & Pascual-Hortal, L. A new habitat availability index to integrate connectivity in landscape conservation planning: comparison with existing indices and application to a case study. Landsc. Urban Plan. 83, 91–103 (2007).
Rothley, K. Finding and filling the” cracks” in resistance surfaces for least-cost modeling. Ecol. Soc. 10, 4 (2005).
Theobald, D. M. A note on creating robust resistance surfaces for computing functional landscape connectivity. Ecol. Soc. 10, 10 (2005).
Verburg, P. H., Erb, K.-H., Mertz, O. & Espindola, G. Land System Science: between global challenges and local realities. (Elsevier, 2013).
Vadjunec, J., Frazier, A., Kedron, P., Fagin, T. & Zhao, Y. A Land Systems Science Framework for Bridging Land System Architecture and Landscape Ecology: A Case Study from the Southern High Plains. Land 7, 27 (2018).
Geospatial Centre ABMI. Human Footprint Inventory Metadata 2016. (2018).
Koen, E. L., Garroway, C. J., Wilson, P. J. & Bowman, J. The effect of map boundary on estimates of landscape resistance to animal movement. Plos One 5, e11785 (2010).
Government of Canada. Land Use 2010. http://open.canada.ca/data/en/dataset/9e1efe92-e5a3-4f70-b313-68fb1283eadf (2015).
Government of Canada. GeoBase - National Road Network. http://geogratis.gc.ca/api/en/nrcan-rncan/ess-sst/c0db1b2e-bdaf-6998-8b8e-e569e5d39d6b.html (2012).
Government of Canada. GeoBase - National Railway Network, http://geogratis.gc.ca/api/en/nrcan-rncan/ess-sst/41049aec-b400-a1c1-0b85-9282973d752d.html (2013).
Homer, C. G. et al. Completion of the 2011 National Land Cover Database for the conterminous United States-Representing a decade of land cover change information. Photogramm. Eng. Remote Sens. 81, 345–354 (2015).
Bonham-Carter, G. F. Geographic Information Systems for geoscientists: modeling with GIS. vol. 13 (Pergamon, 1994).
Gesch, D. B., Evans, G. A., Oimoen, M. J. & Arundel, S. The National Elevation Dataset. In 83–110 (American Society for Photogrammetry and Remote Sensing, 2018).
Hijmans, R. J. raster: Geographic Data Analysis and Modeling. R package version 2.6-7, https://CRAN.R-project.org/package=raster (2017).
Quantum GIS Development Team. QGIS Geographic Information System. Open Source Geospatial Foundation Project, http://qgis.osgeo.org 2017).
Legendre, P. & Legendre, L. F. Numerical ecology. Third edition. vol. 24 (Elsevier, 2012).
Oksanen, J. et al. vegan: Community Ecology Package. R package version 2.5-2, https://CRAN.R-project.org/package=vegan (2018).
R Core Team. R: A language and environment for statistical computing. R Foundation for Statistical Computing, Vienna, Austria. URL, https://www.R-project.org/ (2016).
Acknowledgements
We thank Paul Leonard for his help with implementing and using GFlow. We thank David Theobald for his advices on applying his methodology. We thank the ABMI’s Application Centre (Ecosystem Services Assessment Project funded by the Alberta Innovates: Grant # BIO-12-006); and ABMI’s Geospatial Centre especially Carrie Selin and the HF mapping team members. We thank the AHFMP Technical Committee Members for their help on defining intensity values of human-footprint categories. RM and HAM were funded through the ABMI Ecosystem Services Assessment Project funded by the Alberta Innovates (Grant # BIO-12-006) and the ABMI Human Footprint Inventory Program. HAM was also funded by the Centre for Urban Environments (CUE) postdoctoral grant. The project was further supported by HW’s NSERC Discovery grant. This research was enabled in part by support provided by SciNet (https://www.scinethpc.ca/) and Compute Canada (www.computecanada.ca). Computations were performed on the UTM Research Cluster, and the Niagara supercomputer at the SciNet HPC Consortium. SciNet is funded by the Canada Foundation for Innovation, the Government of Ontario, Ontario Research Fund - Research Excellence, and the University of Toronto.
Author information
Authors and Affiliations
Contributions
R.M., H.W., M.I., and J.K. conceived the study. J.K. and B.H. collected and managed the original G.I.S. data, B.H. led the expert H.F. committee, R.M. and H.A.M. carried out the G.I.S. and statistical analyses, R.M. drafted the first version of the manuscript with H.W. and H.A.M. contributing sections. All authors provided comments on the manuscript.
Corresponding author
Ethics declarations
Competing interests
The research project has been supported by the Alberta Biodiversity Monitoring Institute (ABMI) as part of the ABMI Ecosystem Services Assessment Project funded by the Alberta Innovates (see below), and MI, BH, and JK are employed by the ABMI.
Additional information
Publisher’s note Springer Nature remains neutral with regard to jurisdictional claims in published maps and institutional affiliations.
Supplementary information
Rights and permissions
Open Access This article is licensed under a Creative Commons Attribution 4.0 International License, which permits use, sharing, adaptation, distribution and reproduction in any medium or format, as long as you give appropriate credit to the original author(s) and the source, provide a link to the Creative Commons license, and indicate if changes were made. The images or other third party material in this article are included in the article’s Creative Commons license, unless indicated otherwise in a credit line to the material. If material is not included in the article’s Creative Commons license and your intended use is not permitted by statutory regulation or exceeds the permitted use, you will need to obtain permission directly from the copyright holder. To view a copy of this license, visit http://creativecommons.org/licenses/by/4.0/.
About this article

Cite this article
Marrec, R., Abdel Moniem, H.E., Iravani, M. et al. Conceptual framework and uncertainty analysis for large-scale, species-agnostic modelling of landscape connectivity across Alberta, Canada. Sci Rep 10, 6798 (2020). https://doi.org/10.1038/s41598-020-63545-z
Received:
Accepted:
Published:
DOI: https://doi.org/10.1038/s41598-020-63545-z
This article is cited by
-
Integrating remote sensing data on habitat suitability and functional connectivity to inform multitaxa roadkill mitigation plans
Landscape Ecology (2023)
-
Comparison and parallel implementation of alternative moving-window metrics of the connectivity of protected areas across large landscapes
Landscape Ecology (2023)
-
Quaternary landscape dynamics boosted species dispersal across Southeast Asia
Communications Earth & Environment (2021)
-
Trends in Wildlife Connectivity Science from the Biodiverse and Human-Dominated South Asia
Journal of the Indian Institute of Science (2021)
Comments
By submitting a comment you agree to abide by our Terms and Community Guidelines. If you find something abusive or that does not comply with our terms or guidelines please flag it as inappropriate.
