The data behind Carlsbad’s emergency proclamation for e-bike, bicycle accidents
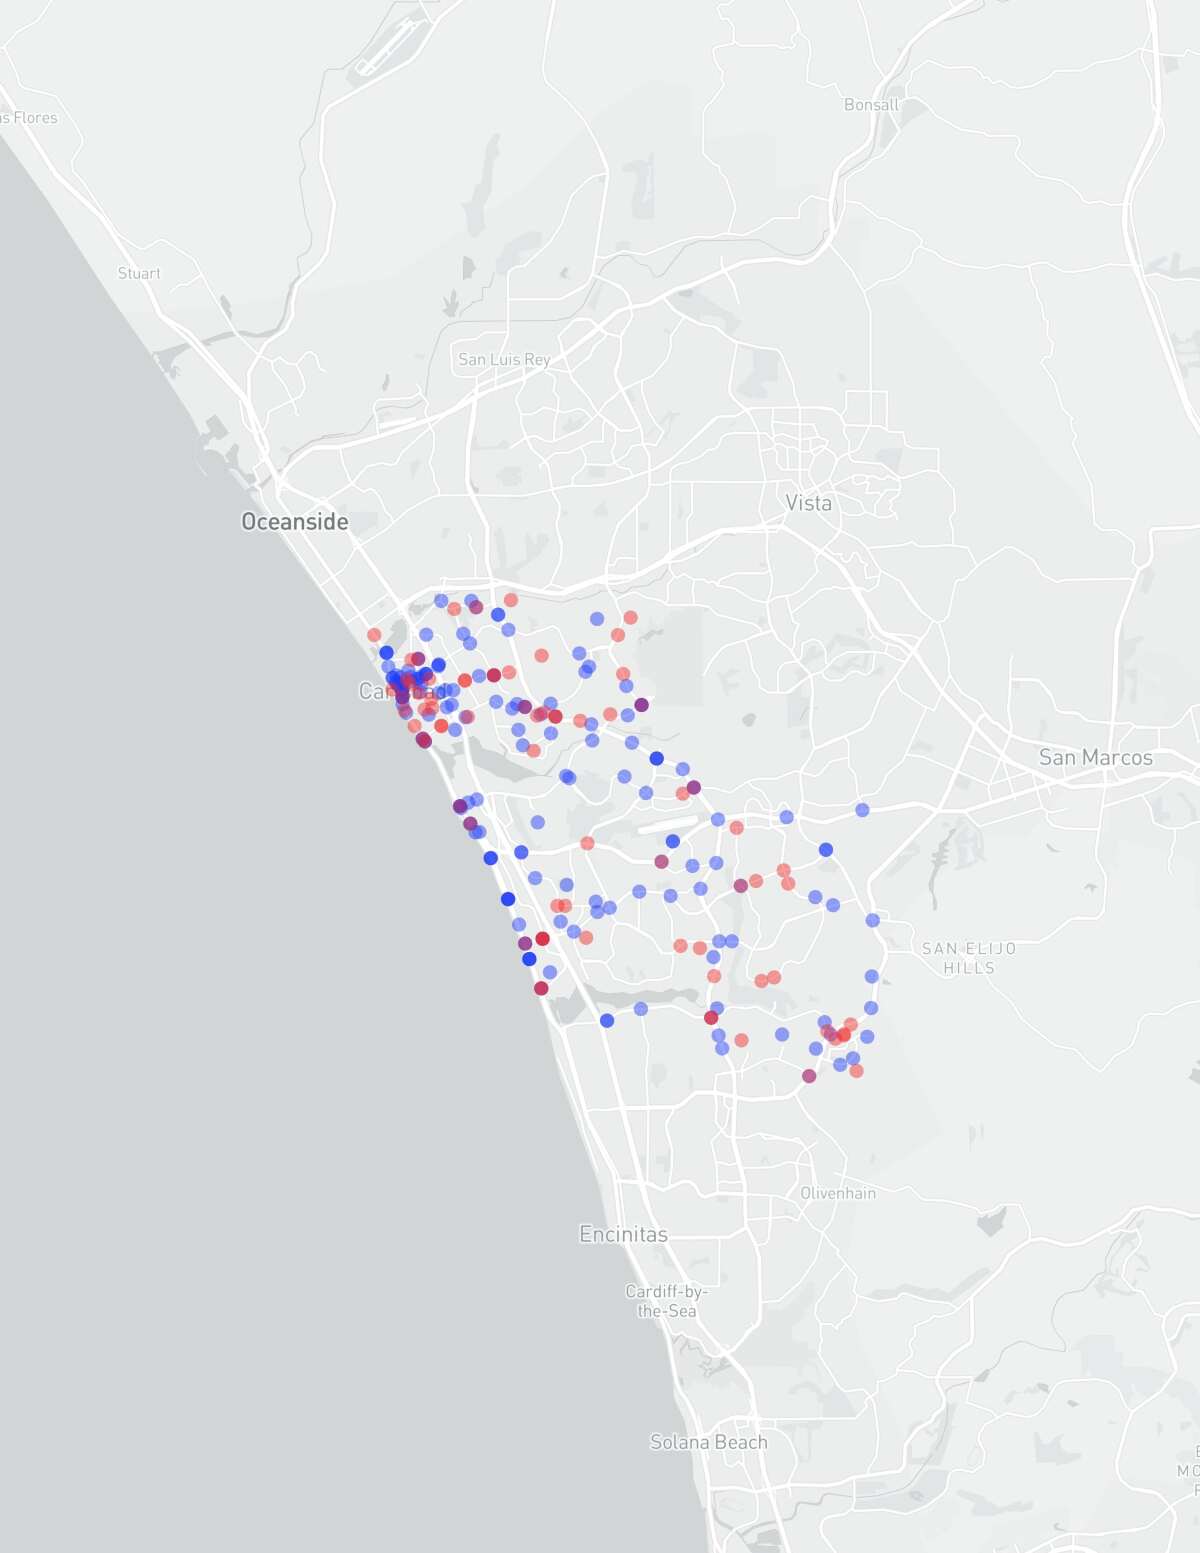
Data shows more than half involve vehicles, most accidents occur along coastline
Carlsbad City Council members continued their discussion on improving street safety Sept. 27, one month after the city declared a local state of emergency due to an increase in traffic accidents involving bicycles and e-bikes.
“Even though the dramatic increase in collisions involve bikes and e-bikes, we know that it takes everyone working together to use our roadways in a safe and responsible manner,” Assistant City Manager Geoff Patnoe said during a recent council meeting. “That is why we’re not focused on any one mode of travel, but emphasizing the need for everyone to do their part.”
The emergency proclamation cited a 233 percent increase in accidents involving e-bikes and bicycles, many of which also involved automobiles. After 30 total accidents in 2019, there were 62 in 2020, 100 in 2021 and 57 through the first seven months of 2022. Most resulted in injuries, and there was one fatal collision earlier in 2022.
There were also two August deaths not covered by the data, including 35-year-old Carlsbad resident Christine Embree. Embree collided with a Toyota 4-Runner near the corner of Basswood Avenue and Valley Street while riding an e-bike with her 1-year-old daughter, who survived.
The Del Mar Times, a publication of the U-T Community Press, obtained data for each of those 249 accidents cited in the city’s proclamation through a public records request. Here are some of the key trends:
1. The coastline has experienced the most accidents
- Bicycle accidents
- Ebike accidents
About 40 percent of the accidents occurred along the coast, west of Interstate 5. The three census tracts that cover the northwestern tip of the city, where Carlsbad Village is located, were a particular hotspot. About 1 in 4 of the accidents took place there.
Census tracts are geographical subdivisions that each have about 1,200 to 8,000 people, according to the Census Bureau. Carlsbad is made up of 27 census tracts.
2. The percentage of accidents involving e-bikes sharply increased
Out of the 92 accidents in 2019 and 2020 that the city recorded, only about 11 percent involved e-bikes. That figure jumped to 33 percent in 2021, with 33 of 100 accidents involving an e-bike.
According to the 2022 data, which covers January through July, more than half of the 57 accidents reported involved e-bikes.
Those numbers coincide with the increased popularity of e-bikes. According to the market research firm NPD Group, e-bike revenue increased 47 percent over a 12-month period ending in October 2021, compared to the same period of time in 2020.
3. More than half of accidents involved cars
An automobile was involved in 136 of the 249 accidents, or about 54 percent. The automobile was at fault in 48 percent of those 136 accidents, according to the city, and the e-bike or bike rider was at fault 44 percent of the time. In the other 8 percent, the party at fault could not be determined.
4. Types of collisions and how they happened
Almost 9 in 10 accidents fell into one of these categories: broadside, sideswipe, rear-end, hit object or other.
According to the city, accidents that were classified as “other” included an e-bike rider who was found unconscious, but there were no witnesses and apparently no other vehicles involved; an e-bike rider who was injured after slamming their brakes to avoid hitting a vehicle; and riders who were injured due to bent rims, seats falling off or other equipment issues.
Nearly 2 in 3 accidents were due to unsafe speed, improper turning, automobile right-of-way violations or other improper driving.
5. When do most accidents take place?
Accidents were almost twice as likely to happen on Saturdays than Mondays. Other than that difference, the number of accidents was distributed fairly evenly throughout the other days of the week.
For the most, accidents were evenly distributed by season as well — 29.7 percent in summer, 25.3 percent in winter, 23.3 percent in spring and 21.7 percent in fall. But accidents in July and August were twice as frequent as accidents in November and December.
Get North County news in your inbox
Top stories from the San Diego North County every Monday, Wednesday, and Friday.
You may occasionally receive promotional content from the San Diego Union-Tribune.


