
The personal drama that can erupt between couples as they try to balance what they want in their dream home with what they can afford played out on a national stage recently and featured Spotsylvania County residents Shamila and Vernon Beslow.
She’d been modeling since she was a teenager and was used to the lights, camera and action. But it was another matter for Vernon, a cybersecurity officer for the federal government.
Several days into the filming of “House Hunters,” he was clearly “over it,” his wife said, and he wondered why he’d gotten himself into the reality show in the first place.
Some of that comes through in this season’s Episode 10, titled, “Practical vs. Grand in Virginia,” as well as some well-known views of Fredericksburg landmarks. The segment already has aired four times and is available on demand, on HGTV or Philo.
People are also reading…
While Vernon represents the practical side — and said several times he feared he’d end up broke — Shamila is the “grand” element in this equation.
She said some of that is a result of dealing with two serious autoimmune diseases. She’s got permanent nerve damage, pain and numbness in her left leg after a 2018 episode that temporarily put her in a wheelchair.
She was eventually diagnosed with Guillain–Barré syndrome, a rare condition affecting the nerves, and she has lupus, which occurs when the immune system attacks healthy tissues and organs.
“Because of what I’ve been through, I just kind of want what I want and I know what I deserve,” the 43-year-old said. “I’m going to live my life to the fullest.”
The Beslows, who have a 7-year-old daughter, Aria, decided to move last year because their former home, near Lee’s Hill in Spotsylvania, was on “a massive hill,” she said. If her condition caused paralysis again, it would be difficult to get her in and out of the house, and there was no main level where she had everything she needed.
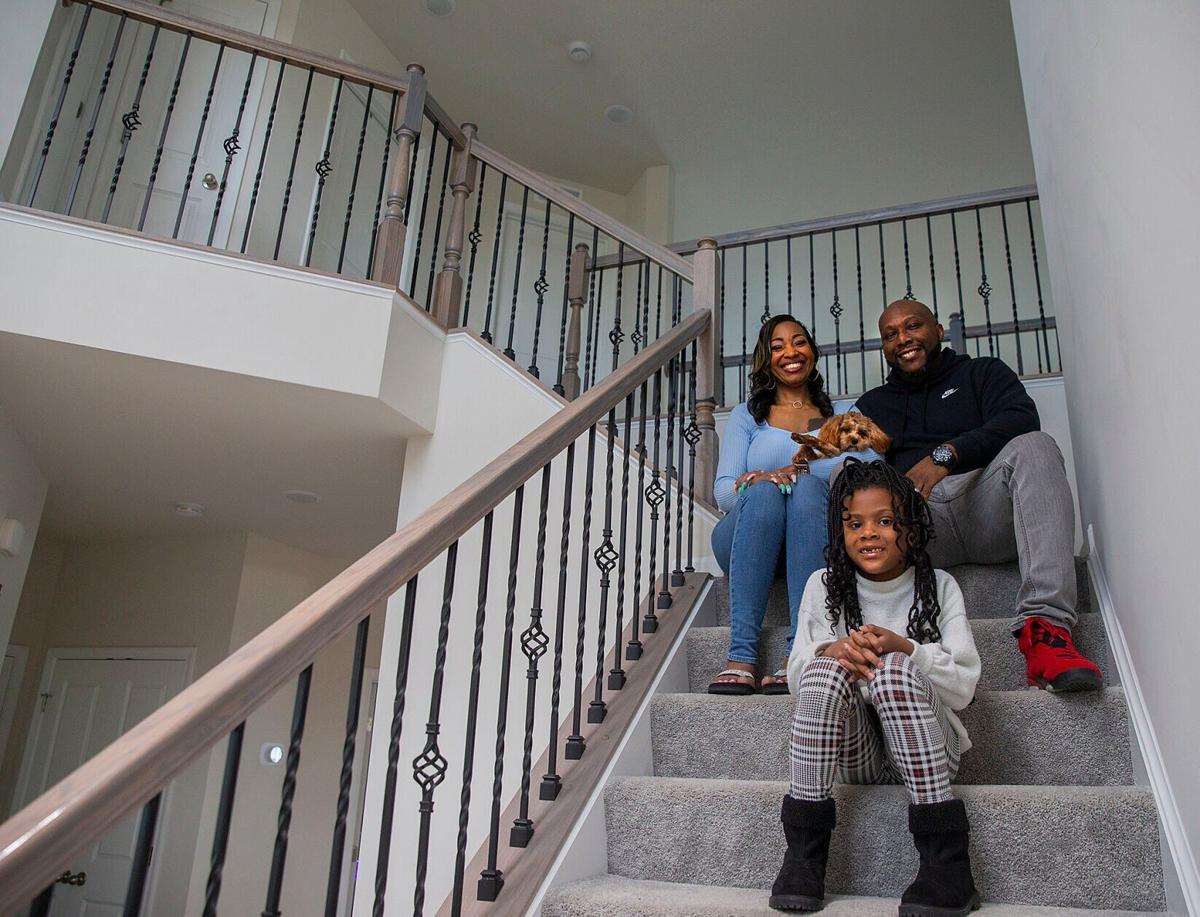
The “House Hunters” episode chronicles “a rollercoaster of emotions,” according to the network, as he advocated for an affordable one-story dwelling and she wanted a home with a grand staircase. She said she’s pictured that since childhood, with her husband standing on the landing.
After several starts and stops, the Beslows’ search ended at The River Front in New Post, near Belvedere Farm. She’s thrilled at the sight of nearby tractors working the fields, and their $739,000 home includes two stories, a basement and the grand staircase she envisioned.
But it’s also got everything she’d need on the main level, should the paralysis put her in a wheelchair again. The office, where she works as a financial counselor and helps others starting their own business, could serve as a bedroom. Everything else on the first floor is easily accessible, and she can control kitchen appliances and door locks with her smart phone.
Vernon is happy, too.
“The house is great and the community is fantastic,” he said, adding he isn’t quite as pleased with the builder.
They’ve been excited to discover that some of their neighbors also were formerly stationed at the Pentagon, as Vernon was, and they’ve joined in community activities such as the recent Easter egg hunt.
Being part of the “House Hunters” filming was an experience, for the Beslows as well as Realtor Khaliyah Barakhyahu.
“It was work, but it was enjoyable work,” Barakhyahu said. “And the Beslows, they’re awesome.”
Shamila Beslow said the filming, and visiting various houses, took eight hours a day, for six days over the course of two weeks. The film crew provided everything they asked for, from meals and snacks to fixing their hair and clothes.
“You feel like you’re a big-time celebrity,” she said.
David Bromstad's name is synonymous with HGTV, but that wasn't always the case. He grew up with a very different dream, and there were many twists and turns that led him to the life he lives today.
Localities with the oldest homes in Virginia
Localities with the oldest homes in Virginia

There's an undeniable charm that comes with pre-World War II American architecture, characterized by high ceilings, crown molding, hardwood floors, and ornate details. In fact, 12.8% of all housing units in America were built in 1939 or before, showing the popularity of the preservation of these units. Owning a piece of history can sometimes come with a cost: Many old homes come with asbestos, lead piping, knob-and-tube wiring, and other outdated building styles that can rack up a hefty price tag to modernize. However, with more and more modernized pre-war homes on the market, generally located just outside bustling downtown metros, investing in property that has withstood the test of time is an attractive prospect.
Stacker compiled a list of the localities in Virginia with the oldest homes using data from the U.S. Census Bureau. Localities are ranked by median year the structure was built according to 2020 5-year estimates. Ties broken by the highest percentage of homes built before 1939.
The country's domestic architecture is perhaps best characterized by a rugged individualism as opposed to the hybridization of disparate architectural elements. As Maya Angelou once perceptively observed, "the ache for home lives in all of us," a phrase that has meant very different things to different people.
Modest or palatial, there is no shortage of noteworthy homes in the U.S. Log cabins constructed by industrious pioneers have dotted the landscape alongside traditional Native American dwellings ever since immigrant Swedes introduced them to the New World in 1638. The unprecedented personal fortunes amassed by the so-called "Robber Barons" at the close of the 19th century gave way to the construction of a staggering number of Gilded Age estates.
The ravages of time spared neither the sumptuous nor the humble. Stately mansions, often prohibitively costly to maintain in the modern era, were frequently neglected; simple structures were forgotten, discarded by their owners, and damaged by natural elements. However, the tireless efforts of architectural preservationists and local historical societies have saved many of these homes from demolition, leading to their inclusion in the National Register of Historic Places and thereby safeguarding them for future generations.
Keep reading to learn more about which localities in Virginia have the oldest homes.
You may also like: Cities with the most expensive homes in Virginia
#50. Greensville County

- Median year homes built: 1977
- Homes built 1939 or earlier: 9.7% (407 homes)
- Homes built since 2000: 18.8% (790 homes)
- Total homes built: 4,192
#49. Southampton County

- Median year homes built: 1977
- Homes built 1939 or earlier: 13.8% (1,058 homes)
- Homes built since 2000: 20.2% (1,542 homes)
- Total homes built: 7,648
#48. Wythe County

- Median year homes built: 1977
- Homes built 1939 or earlier: 14.4% (2,071 homes)
- Homes built since 2000: 20.7% (2,987 homes)
- Total homes built: 14,402
#47. Amherst County

- Median year homes built: 1976
- Homes built 1939 or earlier: 11.0% (1,569 homes)
- Homes built since 2000: 12.8% (1,827 homes)
- Total homes built: 14,237
#46. Lee County

- Median year homes built: 1976
- Homes built 1939 or earlier: 11.4% (1,349 homes)
- Homes built since 2000: 11.7% (1,386 homes)
- Total homes built: 11,800
You may also like: Counties in Virginia where people spend most of their paycheck on housing
#45. Scott County

- Median year homes built: 1976
- Homes built 1939 or earlier: 12.4% (1,488 homes)
- Homes built since 2000: 15.2% (1,818 homes)
- Total homes built: 11,960
#44. Hampton

- Median year homes built: 1975
- Homes built 1939 or earlier: 6.5% (3,934 homes)
- Homes built since 2000: 12.6% (7,577 homes)
- Total homes built: 60,145
#43. Mathews County

- Median year homes built: 1975
- Homes built 1939 or earlier: 22.3% (1,284 homes)
- Homes built since 2000: 12.1% (697 homes)
- Total homes built: 5,758
#42. Henry County

- Median year homes built: 1974
- Homes built 1939 or earlier: 5.3% (1,378 homes)
- Homes built since 2000: 8.7% (2,280 homes)
- Total homes built: 26,193
#41. Arlington County

- Median year homes built: 1974
- Homes built 1939 or earlier: 8.2% (9,495 homes)
- Homes built since 2000: 23.8% (27,714 homes)
- Total homes built: 116,248
You may also like: Zip codes with the most expensive homes in Virginia
#40. Lunenburg County

- Median year homes built: 1974
- Homes built 1939 or earlier: 10.6% (638 homes)
- Homes built since 2000: 12.5% (751 homes)
- Total homes built: 5,994
#39. Halifax County

- Median year homes built: 1974
- Homes built 1939 or earlier: 11.7% (2,132 homes)
- Homes built since 2000: 12.2% (2,224 homes)
- Total homes built: 18,215
#38. Norton

- Median year homes built: 1974
- Homes built 1939 or earlier: 12.2% (256 homes)
- Homes built since 2000: 6.4% (135 homes)
- Total homes built: 2,105
#37. Charlotte County

- Median year homes built: 1974
- Homes built 1939 or earlier: 15.4% (978 homes)
- Homes built since 2000: 11.5% (733 homes)
- Total homes built: 6,351
#36. Smyth County

- Median year homes built: 1973
- Homes built 1939 or earlier: 12.2% (1,871 homes)
- Homes built since 2000: 9.9% (1,524 homes)
- Total homes built: 15,366
You may also like: Countries Virginia exports the most goods to
#35. Tazewell County

- Median year homes built: 1973
- Homes built 1939 or earlier: 13.4% (2,777 homes)
- Homes built since 2000: 11.6% (2,409 homes)
- Total homes built: 20,731
#34. Radford

- Median year homes built: 1973
- Homes built 1939 or earlier: 13.9% (904 homes)
- Homes built since 2000: 9.2% (601 homes)
- Total homes built: 6,522
#33. Grayson County

- Median year homes built: 1973
- Homes built 1939 or earlier: 17.1% (1,582 homes)
- Homes built since 2000: 15.0% (1,389 homes)
- Total homes built: 9,262
#32. Nottoway County

- Median year homes built: 1973
- Homes built 1939 or earlier: 17.3% (1,176 homes)
- Homes built since 2000: 15.8% (1,077 homes)
- Total homes built: 6,813
#31. Alexandria

- Median year homes built: 1972
- Homes built 1939 or earlier: 8.4% (6,432 homes)
- Homes built since 2000: 17.1% (13,055 homes)
- Total homes built: 76,361
You may also like: Counties with the highest COVID-19 vaccination rate in Virginia
#30. Pulaski County

- Median year homes built: 1972
- Homes built 1939 or earlier: 11.7% (2,021 homes)
- Homes built since 2000: 12.7% (2,197 homes)
- Total homes built: 17,289
#29. Bath County

- Median year homes built: 1972
- Homes built 1939 or earlier: 21.2% (706 homes)
- Homes built since 2000: 13.0% (434 homes)
- Total homes built: 3,336
#28. Page County

- Median year homes built: 1972
- Homes built 1939 or earlier: 22.2% (2,616 homes)
- Homes built since 2000: 14.6% (1,716 homes)
- Total homes built: 11,783
#27. Giles County

- Median year homes built: 1971
- Homes built 1939 or earlier: 12.3% (1,025 homes)
- Homes built since 2000: 12.6% (1,054 homes)
- Total homes built: 8,360
#26. Falls Church

- Median year homes built: 1970
- Homes built 1939 or earlier: 5.7% (349 homes)
- Homes built since 2000: 28.4% (1,724 homes)
- Total homes built: 6,080
You may also like: Best private high schools in Virginia
#25. Hopewell

- Median year homes built: 1970
- Homes built 1939 or earlier: 10.0% (1,031 homes)
- Homes built since 2000: 12.0% (1,241 homes)
- Total homes built: 10,354
#24. Galax

- Median year homes built: 1970
- Homes built 1939 or earlier: 10.5% (337 homes)
- Homes built since 2000: 8.9% (288 homes)
- Total homes built: 3,222
#23. Charlottesville

- Median year homes built: 1970
- Homes built 1939 or earlier: 13.9% (2,875 homes)
- Homes built since 2000: 20.4% (4,237 homes)
- Total homes built: 20,736
#22. Highland County

- Median year homes built: 1970
- Homes built 1939 or earlier: 33.6% (625 homes)
- Homes built since 2000: 13.8% (256 homes)
- Total homes built: 1,859
#21. Colonial Heights

- Median year homes built: 1969
- Homes built 1939 or earlier: 5.9% (452 homes)
- Homes built since 2000: 8.3% (640 homes)
- Total homes built: 7,724
You may also like: Most diverse counties in Virginia
#20. Emporia

- Median year homes built: 1969
- Homes built 1939 or earlier: 7.7% (198 homes)
- Homes built since 2000: 11.8% (303 homes)
- Total homes built: 2,569
#19. Salem

- Median year homes built: 1969
- Homes built 1939 or earlier: 14.2% (1,538 homes)
- Homes built since 2000: 9.3% (1,014 homes)
- Total homes built: 10,846
#18. Buena Vista

- Median year homes built: 1969
- Homes built 1939 or earlier: 14.5% (417 homes)
- Homes built since 2000: 10.8% (309 homes)
- Total homes built: 2,866
#17. Lynchburg

- Median year homes built: 1969
- Homes built 1939 or earlier: 17.3% (5,642 homes)
- Homes built since 2000: 16.0% (5,192 homes)
- Total homes built: 32,533
#16. Winchester

- Median year homes built: 1969
- Homes built 1939 or earlier: 20.8% (2,489 homes)
- Homes built since 2000: 13.0% (1,560 homes)
- Total homes built: 11,980
You may also like: Best colleges in Virginia
#15. Fairfax

- Median year homes built: 1968
- Homes built 1939 or earlier: 0.9% (83 homes)
- Homes built since 2000: 14.8% (1,339 homes)
- Total homes built: 9,019
#14. Waynesboro

- Median year homes built: 1968
- Homes built 1939 or earlier: 12.1% (1,220 homes)
- Homes built since 2000: 15.5% (1,564 homes)
- Total homes built: 10,059
#13. Alleghany County

- Median year homes built: 1968
- Homes built 1939 or earlier: 16.6% (1,330 homes)
- Homes built since 2000: 8.0% (639 homes)
- Total homes built: 8,036
#12. Petersburg

- Median year homes built: 1968
- Homes built 1939 or earlier: 16.8% (2,747 homes)
- Homes built since 2000: 12.7% (2,075 homes)
- Total homes built: 16,346
#11. Franklin

- Median year homes built: 1967
- Homes built 1939 or earlier: 10.8% (415 homes)
- Homes built since 2000: 10.5% (404 homes)
- Total homes built: 3,843
You may also like: Highest-rated specialty museums in Virginia, according to Tripadvisor
#10. Bristol

- Median year homes built: 1967
- Homes built 1939 or earlier: 13.7% (1,190 homes)
- Homes built since 2000: 9.8% (855 homes)
- Total homes built: 8,714
#9. Portsmouth

- Median year homes built: 1966
- Homes built 1939 or earlier: 13.1% (5,372 homes)
- Homes built since 2000: 9.4% (3,833 homes)
- Total homes built: 40,879
#8. Staunton

- Median year homes built: 1965
- Homes built 1939 or earlier: 19.3% (2,281 homes)
- Homes built since 2000: 14.1% (1,675 homes)
- Total homes built: 11,847
#7. Norfolk

- Median year homes built: 1963
- Homes built 1939 or earlier: 15.2% (14,960 homes)
- Homes built since 2000: 12.5% (12,243 homes)
- Total homes built: 98,142
#6. Martinsville

- Median year homes built: 1962
- Homes built 1939 or earlier: 11.4% (805 homes)
- Homes built since 2000: 4.3% (307 homes)
- Total homes built: 7,062
You may also like: Highest-rated Class of 2022 football recruits from Virginia
#5. Danville

- Median year homes built: 1962
- Homes built 1939 or earlier: 16.9% (3,724 homes)
- Homes built since 2000: 3.9% (869 homes)
- Total homes built: 22,017
#4. Roanoke

- Median year homes built: 1958
- Homes built 1939 or earlier: 25.0% (11,730 homes)
- Homes built since 2000: 6.9% (3,231 homes)
- Total homes built: 46,991
#2. Lexington

- Median year homes built: 1956
- Homes built 1939 or earlier: 37.7% (906 homes)
- Homes built since 2000: 2.1% (51 homes)
- Total homes built: 2,405
#1. Covington

- Median year homes built: 1950
- Homes built 1939 or earlier: 30.6% (915 homes)
- Homes built since 2000: 2.8% (83 homes)
- Total homes built: 2,987
You may also like: Best high schools in Virginia
