

Lincoln Public Schools struck a deal with a local developer to exchange 62.5 acres near 84th and O streets known as Spirit Park for 18.7 acres west of U.S. 77 as a site for a future elementary school.
As part of the exchange, Southwest Folsom Development also would pay LPS $2.3 million, but the developer could opt out of the exchange altogether and sell the land in west Lincoln to LPS for $786,240.
The Lincoln Board of Education considered the deal Tuesday and will vote on its approval Oct. 13.
Scott Wieskamp, LPS operations director, said the district has long been eyeing land in that part of the city — north of Old Cheney Road between Southwest 12th and South Folsom streets — because of ongoing development in that part of town and because the city has identified that area as one of its priorities for development in its comprehensive plan update.
People are also reading…
The deal includes the option for the development company, of which Thomas White is the registered agent, to opt out of the exchange if research on the Spirit Park site near the State Farm building convinces the developers they don’t want to buy it.
LPS has owned that land since it acquired the previous State Farm headquarters at 59th and O streets as its district offices decades ago. That office building burned to the ground in 2011. The YMCA built soccer fields on the Spirit Park site and holds games there regularly, as does LPS.
If the exchange goes forward, the developer has indicated plans to begin grading the land for redevelopment next spring. That means soccer games could continue on the fields through this year, but by next spring both the YMCA and LPS would have to find alternative sites.
LPS is looking into other options now, Wieskamp said, and in another year could have new fields open on the site of a new southeast high school.
The district plans to build two new high schools — one in northwest Lincoln and one in southeast Lincoln — as part of a $290 million bond issue passed by voters in February. Both sites will have shared athletic facilities, and soccer fields will be at the southeast school site near 70th Street and Saltillo Road.
The northwest high school will open in 2022, with the southeast high school to follow in 2023. But the soccer fields may be ready a year earlier, Wieskamp said.
Breaking down Lincoln's public schools
Breaking down Lincoln's public schools: Enrollment, test scores and more
Adams

Adams Elementary: 7401 Jacobs Creek Drive
Enrollment: 776 students
77.9% white, 2.3% Black or African American, 9.6% Asian, 4.9% Hispanic/Latino, 5.4% two or more races
Free and reduced-price lunch participation: 8.6% free, 2.3% reduced
Gifted students: 10.4%
Statewide test scores (percent who meet or exceed standards): 73 language arts; 76 math
Arnold
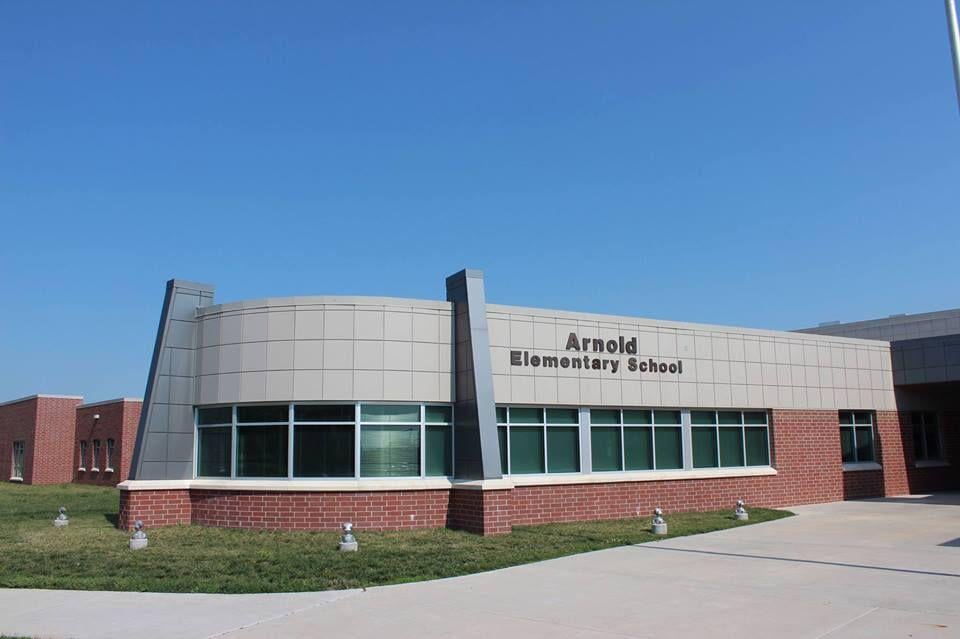
Arnold Elementary: 5000 Mike Scholl St.
Enrollment: 742 students
57.1% white, 1.5% American Indian or Alaska Native, 8.4% Black or African American, 1.5% Asian, 19.2% Hispanic/Latino, 0.3% Native Hawaiian or Pacific Islander, 12% two or more races
Free and reduced-price lunch participation: 46.7% free, 12.7% reduced
Gifted: 2.8%
Statewide test scores (percent who meet or exceed standards): 44 language arts, 32 math
Beattie

Beattie Elementary: 1901 Calvert St.
Enrollment: 368 students
73.6% white, 0.5% American Indian or Alaska Native, 3.3% Black or African American, 1.1% Asian, 8.2% Hispanic/Latino, 13.3% two or more races
Free or reduced-price lunch participation: 25.3% free, 8.2% reduced price
Gifted: 6.0%
Statewide test scores (percent who meet or exceed standards): 59 language arts, 55 math
Belmont

Belmont Elementary: 3425 N. 14th St.
Enrollment: 829 students
42.4% white, 0.9% American Indian or Alaska Native, 15.7% Black or African American, 2.2% Asian, 26.9% Hispanic/Latino, 11.8% two or more races
Free and reduced-price lunch participation: 67.5% free, 11.0% reduced
Gifted: 3.7%
Statewide test scores (percent who meet or exceed standards): 44 language arts, 34 math
Brownell
Brownell Elementary: 6000 Aylesworth Ave.
Enrollment: 320 students
65.9% white, 4.9% Black or African American, 0.3% Asian, 14.8% Hispanic/Latino, 14.1% two or more races
Free and reduced-price lunch participation: 45.2% free, 10.5% reduced
Gifted: 2.3%
Statewide test scores (percent who meet or exceed standards): 50 language arts, 37 math
Calvert
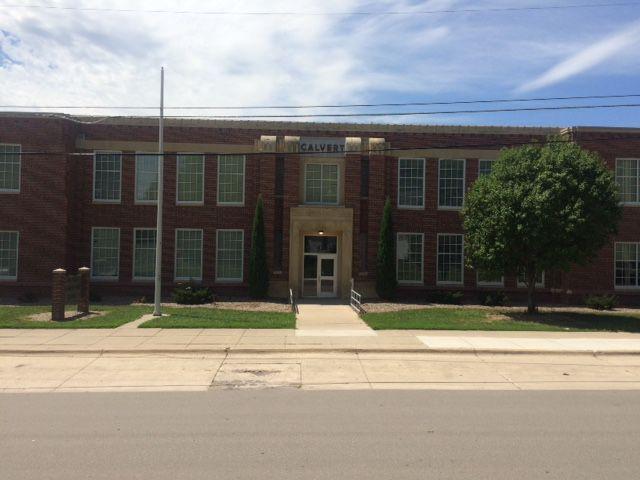
Calvert Elementary: 3709 S. 46th St.
Enrollment: 361 students
62.9% white, 1.2% American Indian or Alaska Native, 7.1% Black or African American, 1.5% Asian, 12.0% Hispanic/Latino, 15.3% two or more races
Free and reduced-price lunch participation: 45.7% free, 6.7% reduced
Gifted: 11.3%
Statewide test scores (percent who meet or exceed standards): 47 language arts, 31 math
Campbell

Campbell Elementary: 2200 Dodge St.
Enrollment: 591 students
46.6% white, 0.4% American Indian or Alaska Native, 14.3% Black or African American, 11.3% Asian, 16.6% Hispanic/Latino, 10.9% two or more races
Free and reduced-price lunch participation: 59.4% free, 10.5% reduced
Gifted: 4.2%
Statewide test scores (percent who meet or exceed standards): 38 language arts, 34 math
Cavett
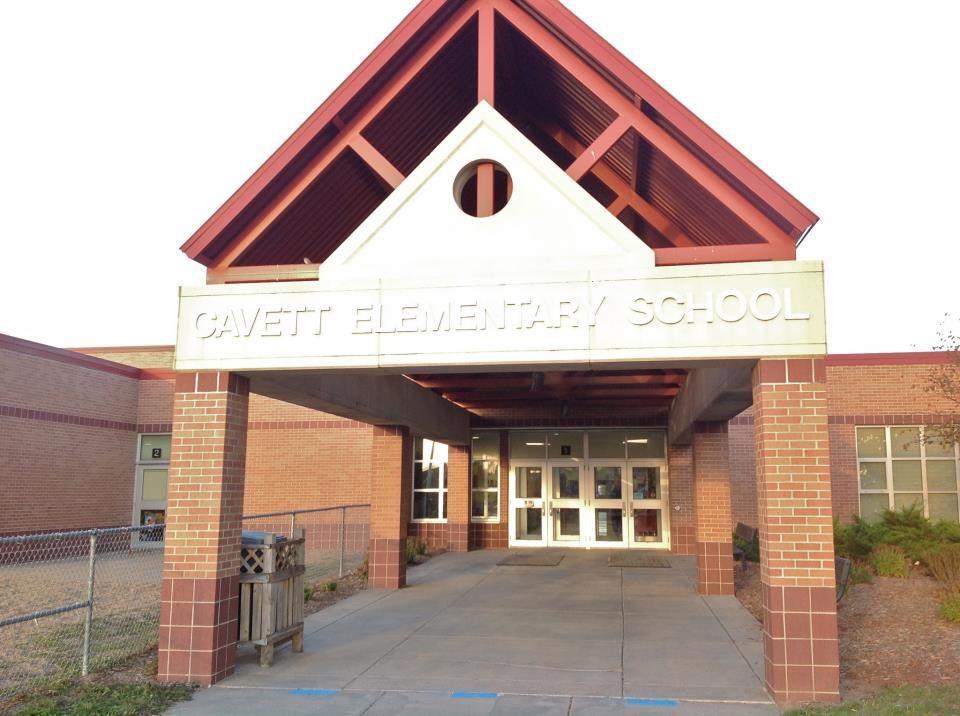
Cavett Elementary: 7701 S. 36th St.
Enrollment: 580 students
77.0% white, 0.5% American Indian or Alaska Native, 2.9% Black or African American, 4.0% Asian, 8.9% Hispanic, 6.6% two or more races
Free and reduced-price lunch participation: 10.4% free, 3.6% reduced
Gifted: 13.3%
Statewide test scores (percent who meet or exceed standards): 70 language arts, 69 math
Clinton
Clinton Elementary: 1520 N. 29th St.
Enrollment: 392 students
39.2% white, 0.3% American Indian or Alaska Native, 24.3% Black or African American, 4.7% Asian, 21.0% Hispanic/Latino, 10.5% two or more races
Free and reduced-price lunch participation: 81.2% free, 10.5% reduced
Gifted: 3.6%
Statewide test scores (percent who meet or exceed standards): 30 language arts, 30 math
Eastridge

Eastridge Elementary: 6245 L St.
Enrollment: 291 students
72.9% white, 1.0% American Indian or Alaska Native, 4.5% Black or African American, 1.4% Asian, 10.3% Hispanic/Latino, 10.0% two or more races
Free and reduced-price lunch participation: 25.8% free, 10.0% reduced
Gifted: 7.9%
Statewide test scores (percent who meet or exceed standards): 55 language arts, 51 math
Elliott
Elliott Elementary: 225 S. 25th St.
Enrollment: 383 students
23.3% white, 1.8% American Indian or Alaska Native, 13.7% Black or African American, 12.8% Asian, 33.7% Hispanic/Latino, 0.3% Native Hawaiian or Pacific Islander, 14.3% two or more races
Free and reduced-price lunch participation: 76.4% free, 6.3% reduced
Gifted: 4.5%
Statewide test scores (percentage who meet or exceed standards): 42 language arts, 35 math
Everett
Everett Elementary: 1123 C St.
Enrollment: 374 students
27.8% white, 0.9% American Indian or Alaska Native, 13.5% Black or African American, 9.9% Asian, 40.4% Hispanic/Latino, 7.5% two or more races
Free and reduced-price lunch participation: 73.7% free, 8.7% reduced
Gifted: 5.4%
Statewide test scores (percentage who meet or exceed standards): 37 language arts, 24 math
Fredstrom

Fredstrom Elementary, 5700 N.W. 10th St.
Enrollment: 437 students
74.0% white, 0.5% American Indian or Alaska Native, 1.7% Black or African American, 3.6% Asian, 9.7% Hispanic, 10.4% two or more races
Free and reduced-price lunch participation: 22.3% free, 6.3% reduced
Gifted: 7.5%
Statewide test scores (percentage who meet or exceed standards): 52 language arts, 54 math
Hartley

Hartley Elementary, 730 N. 33rd St.
Enrollment: 339 students
37.5% white, 2.3% American Indian or Alaska Native, 17.5% Black or African American, 3.6% Asian, 25.9% Hispanic/Latino, 1.0% Native Hawaiian or Pacific Islander, 12.3% two or more races
Free and reduced-price lunch participation: 71.5% free, 9.4% reduced
Gifted: 3.2%
Statewide test scores (percentage who meet or exceed standards): 38 language arts, 28 math
Hill

Hill Elementary, 5230 Tipperary Trail
Enrollment: 449 students
72.2% white, 0.5% American Indian or Alaska Native, 4.8% Black or African American, 5.3% Asian, 10.3% Hispanic/Latino, 7.0% two or more races
Free and reduced-price lunch participation: 24.0% free, 5.0% reduced
Gifted: 10.3%
Statewide test scores (percentage who meet or exceed standards): 70 language arts, 59 math
Holmes

Holmes Elementary, 5230 Sumner St.
Enrollment: 393 students
70.7% white, 3.5% Black or African American, 3.5% Asian, 10.1% Hispanic/Latino, 0.3% Native Hawaiian or Pacific Islander, 11.9% two or more races
Free and reduced-price lunch participation: 37.1% free, 7.0% reduced
Gifted: 11.3%
Statewide test scores (percentage who meet or exceed standards): 61 language arts, 47 math
Humann
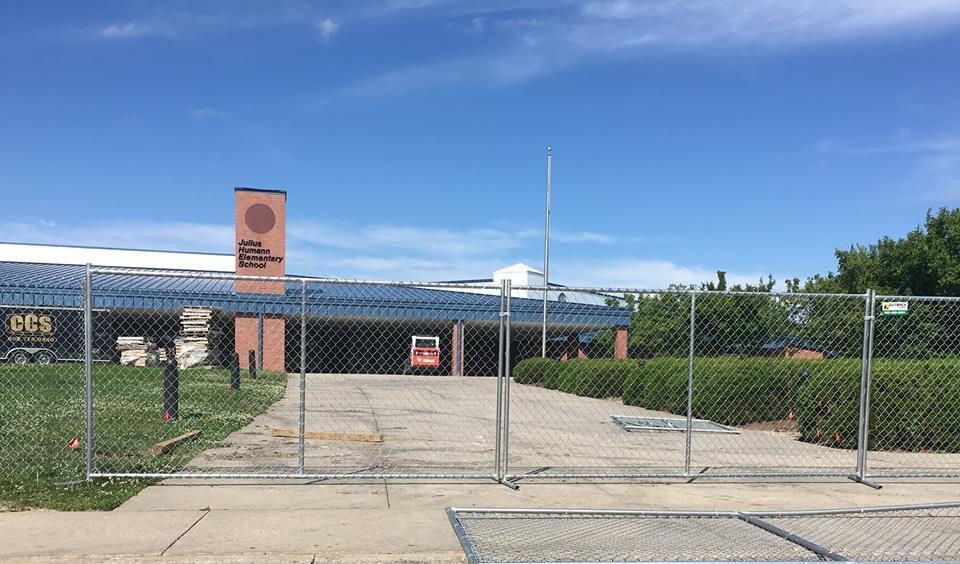
Humann Elementary, 6720 Rockwood Lane
Enrollment: 564 students
78.8% white, 0.6% American Indian or Alaska Native, 4.2% Black or African American, 1.3% Asian, 5.9% Hispanic/Latino, 9.3% two or more races
Free and reduced-price lunch participation: 23.9% free, 4.0% reduced
Gifted: 16.3%
Statewide test scores (percentage who meet or exceed standards): 72 language arts, 67 math
Huntington
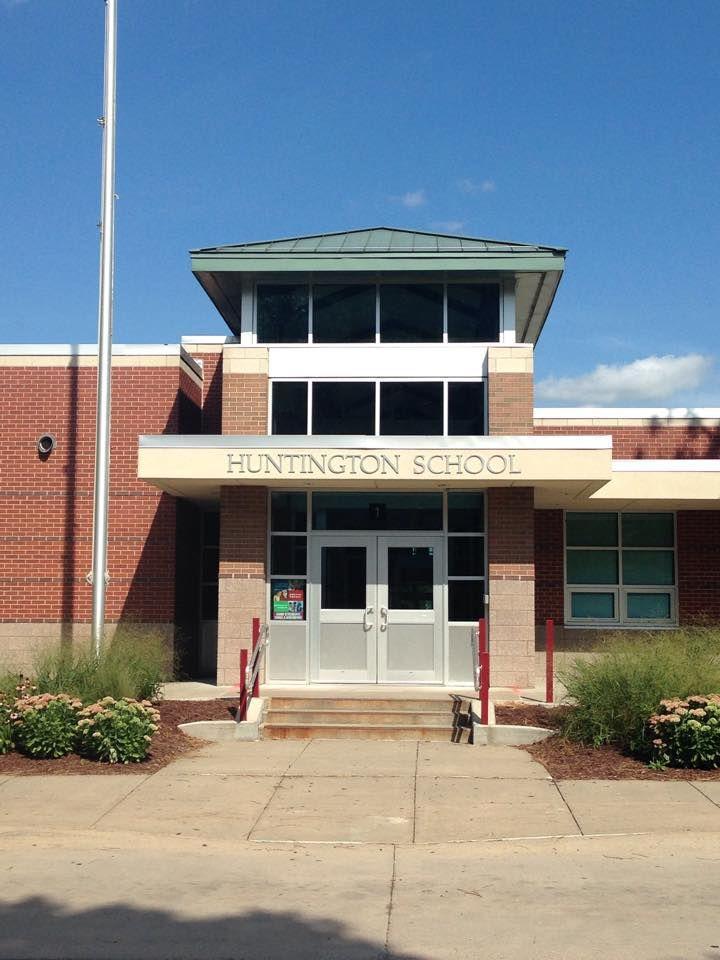
Huntington Elementary, 2900 N. 46th St.
Enrollment: 370 students
45.0% white, 0.6% American Indian or Alaska Native, 12.0% Black or African American, 1.5% Asian, 24.6% Hispanic/Latino, 16.2% two or more races
Free and reduced-price lunch participation: 67.0% free, 14.1% reduced
Gifted: 4.8%
Statewide test scores (percentage who meet or exceed standards): 32 language arts, 23 math
Kahoa

Kahoa Elementary, 7700 Leighton Ave.
Enrollment: 537 students
78.8% white, 0.4% American Indian or Alaska Native, 3.9% Black or African American, 2.6% Asian, 6.7% Hispanic/Latino, 7.6% two or more races
Free and reduced-price lunch participation: 22.9% free, 7.3% reduced
Gifted: 6.9%
Statewide test scores (percentage who meet or exceed standards): 66 language arts, 64 math
Kloefkorn
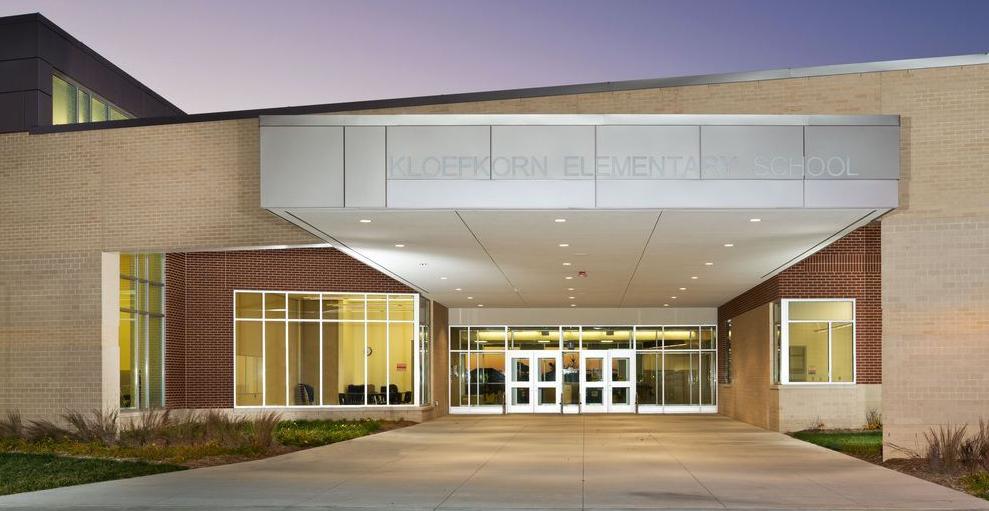
Kloefkorn Elementary, 6601 Glass Ridge Drive
Enrollment: 488 students
83.7% white, 0.7% American Indian or Alaska Native, 1.5% Black or African American, 4.4% Asian, 5.3% Hispanic/Latino, 4.4% two or more races
Free and reduced-price lunch participation: 6.2% free, 2.0% reduced
Gifted: 11.9%
Statewide test scores (percentage who meet or exceed standards): 77 language arts, 72 math
Kooser

Kooser Elementary, 7301 N. 13th St.
Enrollment: 821 students
63.5% white, 0.1% American Indian or Alaska Native, 5.6% Black or African American, 11.9% Asian, 11.1% Hispanic/Latino, 0.1% Native Hawaiian or Pacific Islander, 7.6% two or more races
Free and reduced-price lunch participation: 30.0% free, 8.3% reduced
Gifted: 2.9%
Statewide test scores (percentage who meet or exceed standards): 55 language arts, 49 math
Lakeview

Lakeview Elementary, 300 Capitol Beach Blvd.
Enrollment: 400 students
53.0% white, 0.8% American Indian or Alaska Native, 9.3% Black or African American, 3.8% Asian, 22.8% Hispanic/Latino, 10.5% two or more races
Free and reduced-price lunch participation: 57.0% free, 9.5% reduced
Gifted: 1.8%
Statewide test scores (percentage who meet or exceed standards): 35 language arts, 29 math
Maxey

Maxey Elementary, 5200 S. 75th St.
Enrollment: 683 students
75.9% white, 0.3% American Indian or Alaska Native, 1.2% Black or African American, 13.5% Asian, 3.4% Hispanic/Latino, 0.2% Native Hawaiian or Pacific Islander, 5.5% two or more races
Free and reduced-price lunch participation: 10.6% free, 3.4% reduced
Gifted: 10.4%
Statewide test scores (percentage who meet or exceed standards): 70 language arts, 69 math
McPhee

McPhee Elementary, 820 Goodhue Blvd.
Enrollment: 304 students
26.8% white, 1.4% American Indian or Alaska Native, 16.3% Black or African American, 12.7% Asian, 35.9% Hispanic/Latino and 6.9% two or more races
Free and reduced-price lunch participation: 77.2% free, 6.9% reduced
Gifted: 4.0%
Statewide test scores (percentage who meet or exceed standards): 36 language arts, 22 math
Meadow Lane

Meadow Lane Elementary, 7200 Vine St.
Enrollment: 620 students
72.1% white, 0.2% American Indian or Alaska Native, 2.8% Black or African American, 2.6% Asian, 13.8% Hispanic/Latino, 8.6% two or more races
Free and reduced-price lunch participation: 33.6% free, 8.1% reduced
Gifted: 8.3%
Statewide test scores (percentage who meet or exceed standards): 51 language arts, 39 math
Morley

Morley Elementary, 6800 Monterey Drive
Enrollment: 421 students
78.1% white, 0.2% American Indian or Alaska Native, 3.8% Black or African American, 0.2% Asian, 7.4% Hispanic, 0.5% Native Hawaiian or Pacific Islander, 9.7% two or more races
Free and reduced-price lunch participation: 20.2% free, 5.5% reduced
Gifted: 15.4%
Statewide test scores (percentage who meet or exceed standards): 69 language arts, 56 math
Norwood Park
Norwood Park Elementary, 4710 N. 72nd St.
Enrollment: 238 students
68.0% white, 4.4% Black or African American, 2.4% Asian, 18.9% Hispanic/Latino, 6.3% two or more races
Free and reduced-price lunch participation: 46.6% free, 15.0% reduced
Gifted: 4.9%
Statewide test scores (percentage who meet or exceed standards): 43 language arts, 30 math
Pershing

Pershing Elementary, 6402 Judson St.
Enrollment: 430 students
57.5% white, 0.5% American Indian or Alaska Native, 6.6% Black or African American, 3.3% Asian, 20.6% Hispanic/Latino, 11.5% two or more races
Free and reduced-price lunch participation: 54.5% free, 12.7% reduced
Gifted: 4.3%
Statewide test scores (percentage who meet or exceed standards): 49 language arts, 50 math
Prescott

Prescott Elementary, 1930 S. 20th St.
Enrollment: 492 students
44.9% white, 0.9% American Indian or Alaska Native, 13.8% Black or African American, 7.3% Asian, 18.8% Hispanic/Latino, 0.5% Native Hawaiian or Pacific Islander, 13.8% two or more races
Free and reduced-price lunch participation: 51.2% free, 9.5% reduced
Gifted: 7.5%
Statewide test scores (percentage who meet or exceed standards): 52 language arts, 36 math
Pyrtle
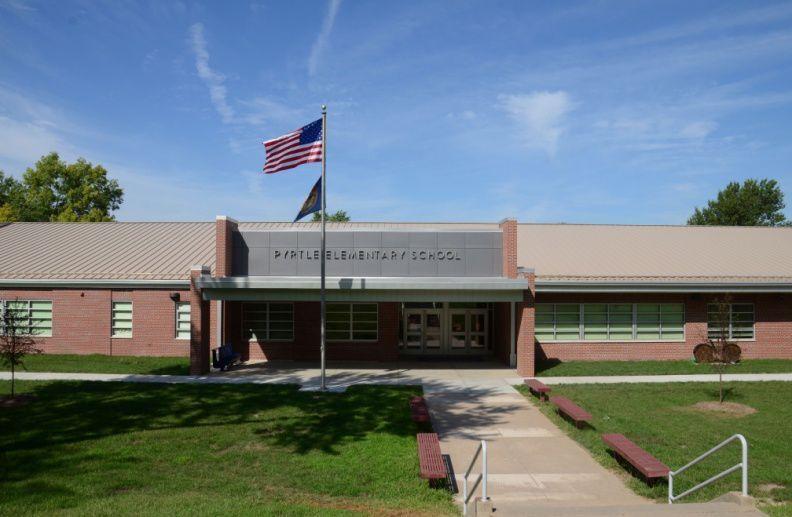
Pyrtle Elementary, 721 Cottonwood Drive
Enrollment: 454 students
78.9% white, 1.9% Black or African American, 2.6% Asian, 10.0% Hispanic/Latino, 6.7% two or more races
Free and reduced-price lunch participation: 17.3% free, 3.6% reduced
Gifted: 17.3%
Statewide test scores (percentage who meet or exceed standards): 68 language arts, 60 math
Randolph

Randolph Elementary, 1024 S. 37th St.
Enrollment: 428 students
61.4% white, 0.9% American Indian or Alaska Native, 5.6% Black or African American, 3.7% Asian, 16.4% Hispanic/Latino, 0.5% Native Hawaiian or Pacific Islander, 11.4% two or more races
Free and reduced-lunch participation: 45.6% free, 8.9% reduced
Gifted: 3.0%
Statewide test scores (percentage who meet or exceed standards): 53 language arts, 40 math
Riley

Riley Elementary, 5021 Orchard St.
Enrollment: 321 students
49.5% white, 0.6% American Indian or Alaska Native, 6.9% Black or African American, 3.4% Asian, 22.7% Hispanic/Latino, 16.8% two or more races
Free and reduced-price lunch participation: 55.1% free, 10.0% reduced
Gifted: 5.3%
Statewide test scores (percentage who meet or exceed standards): 44 language arts, 42 math
Roper

Roper Elementary, 2323 S. Coddington
Enrollment: 803 students
53.5% white, 0.4% American Indian or Alaska Native, 9.9% Black or African American, 6.9% Asian, 21.2% Hispanic/Latino, 8.1% two or more races
Free and reduced-price lunch participation: 40.0% free, 10.4% reduced
Gifted: 6.5%
Statewide test scores (percentage who meet or exceed standards): 44 language arts, 46 math
Rousseau

Rousseau Elementary, 3701 S 33rd St.
Enrollment: 531 students
72.9% white, 0.2% American Indian or Alaska Native, 4.0% Black or African American, 3.4% Asian, 7.0% Hispanic/Latino, 0.2% Native Hawaiian or Pacific Islander, 12.2% two or more races
Free and reduced-price lunch participation: 22.7% free, 8.4% reduced
Gifted: 14.7%
Statewide test scores (percentage who meet or exceed standards): 68 language arts, 63 math
Saratoga
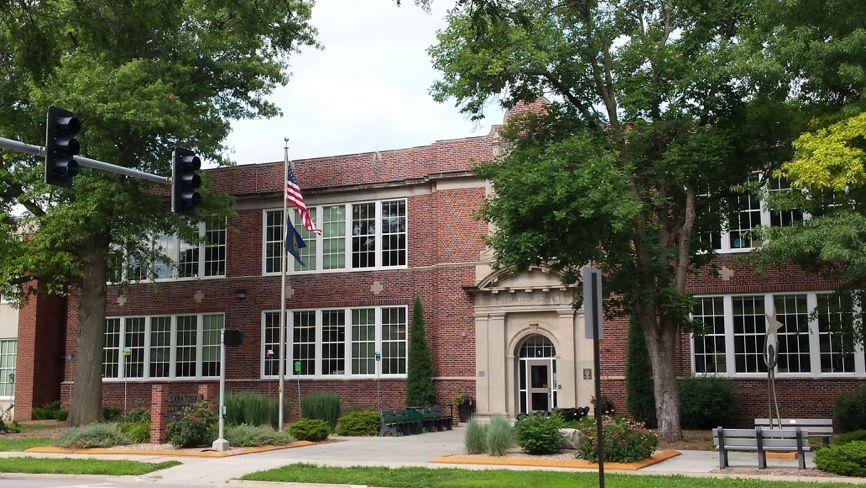
Saratoga Elementary, 2215 S. 13th St.
Enrollment: 235 students
48.5% white, 1.5% American Indian or Alaska Native, 7.8% Black or African American, 3.4% Asian, 26.2% Hispanic/Latino, 12.6% two or more races
Free and reduced-price lunch participation: 61.7% free, 9.7% reduced
Gifted: 5.8%
Statewide test scores (percentage who meet or exceed standards): 36 language arts, 25 math
Sheridan

Sheridan Elementary, 3100 Plymouth Ave.
Enrollment: 407 students
86.0% white, 0.2% American Indian or Alaska Native, 1.5% Black or African American, 0.5% Asian, 4.9% Hispanic/Latino, 6.9% two or more races
Free and reduced-price lunch participation: 12.0% free, 5.2% reduced
Gifted: 17.4%
Statewide test scores (percentage who meet or exceed standards): 74 language arts, 64 math
West Lincoln

West Lincoln Elementary, 630 W. Dawes Ave.
Enrollment: 505 students
37.0% white, 0.4% American Indian or Alaska Native, 9.7% Black or African American, 2.4% Asian, 41.2% Hispanic, 9.3% two or more races
Free and reduced-price lunch participation: 72.1% free, 10.3% reduced
Gifted: 3.8%
Statewide test scores (percentage who meet or exceed standards): 32 language arts, 29 math
Wysong
Wysong Elementary, 7901 Blanchard Blvd.
Enrollment: 684 students
89.9% white, 0.1% Black or African American, 2.2% Asian, 3.8% Hispanic/Latino, 3.9% two or more races
Free and reduced-price lunch participation: 3.9% free, 1.5% reduced
Gifted: 7.5%
Statewide test scores (percentage who meet or exceed standards): 75 language arts, 68 math
Zeman

Zeman Elementary, 4900 S. 52nd St.
Enrollment: 440 students
63.0% white, 0.9% American Indian or Alaska Native, 4.8% Black or African American, 3.0% Asian, 16.1% Hispanic/Latino, 12.3% two or more races
Free and reduced-price lunch participation: 29.5% free, 9.3% reduced
Gifted: 3.4%
Statewide test scores (percentage who meet or exceed standards): 58 language arts, 49 math
Culler

Culler Middle School, 5201 Vine St.
Enrollment: 708 students
39.4% white, 1.0% American Indian or Alaska Native, 14.7% Black or African American, 7.1% Asian, 27.3% Hispanic/Latino, 0.1% Native Hawaiian or Pacific Islander, 10.5% two or more races
Free and reduced-price lunch participation: 60.9% free, 9.3% reduced
Gifted: 8.3%
Statewide test scores (percentage who meet or exceed standards): 32 language arts, 30 math
Dawes
Dawes Middle School, 5130 Colfax Ave.
Enrollment: 398 students
55.0% white, 0.3% American Indian or Alaska Native, 8.3% Black or African American, 2.3% Asian, 19.8% Hispanic/Latino, 14.3% two or more races
Free and reduced-price lunch participation: 53.3% free, 13.1% reduced
Gifted: 10.6%
Statewide test scores (percentage who meet or exceed standards): 37 language arts, 32 math
Goodrich

Goodrich Middle School, 4600 Lewis Ave.
Enrollment: 818 students
42.9% white, 1.1% American Indian or Alaska Native, 13.0% Black or African American, 4.0% Asian, 29.5% Hispanic/Latino, 9.5% two or more races
Free and reduced-price lunch participation: 61.6% free, 11.1% reduced
Gifted: 9.7%
Statewide test scores (percentage who meet or exceed standards): 36 language arts, 38 math
Irving

Irving Middle School, 2745 S. 22nd St.
Enrollment: 910 students
62.7% white, 0.8% American Indian or Alaska Native, 6.5% Black or African American, 3.2% Asian, 14.3% Hispanic/Latino, 12.5% two or more races
Free and reduced-price lunch participation: 35.4% free, 8.1% reduced
Gifted: 26.6%
Statewide test scores (percentage who meet or exceed standards): 55 language arts, 49 math
Lefler
Lefler Middle School, 1100 S. 48th St.
Enrollment: 558 students
57.9% white, 0.7% American Indian or Alaska Native, 9.5% Black or African American, 4.7% Asian, 15.8% Hispanic/Latino, 0.2% Native Hawaiian or Pacific Islander, 11.3% two or more races
Free and reduced-price lunch participation: 43.7% free, 12.0% reduced
Gifted: 13.8%
Statewide test scores (percentage who meet or exceed standards): 45 language arts, 45 math
Lux
Lux Middle School, 7800 High St.
Enrollment: 789 students
80.0% white, 0.1% American Indian or Alaska Native, 2.7% Black or African American, 3.8% Asian, 7.2% Hispanic/Latino, 0.1% Native Hawaiian or Pacific Islander, 6.1% two or more races
Free and reduced-price lunch participation: 10.5% free, 6.3% reduced
Gifted: 28.3%
Statewide test scores (percentage who meet or exceed standards): 66 language arts, 68 math
Mickle
Mickle Middle School, 2500 N. 67th St.
Enrollment: 719 students
70.9% white, 0.1% American Indian or Alaska Native, 2.8% Black or African American, 1.5% Asian, 11.8% Hispanic/Latino, 12.8% two or more races
Free and reduced-price lunch participation: 34.9% free, 9.5% reduced
Gifted: 17.1%
Statewide test scores (percentage who meet or exceed standards): 55 language arts, 53 math
Moore

Moore Middle School, 8700 Yankee Woods Drive
Enrollment: 646 students
86.4% white, 0.6% American Indian or Alaska Native, 0.6% Black or African American, 4.3% Asian, 3.4% Hispanic/Latino, 4.6% two or more races
Free and reduced-price lunch participation: 7.0% free, 2.3% reduced
Gifted: 27.6%
Statewide test scores (percentage who meet or exceed standards): 69 language arts, 78 math
Park
Park Middle School, 855 S. Eighth St.
Enrollment: 833 students
41.2% white, 0.6% American Indian or Alaska Native, 11.9% Black or African American, 6.7% Asian, 30.1% Hispanic/Latino, 0.2% Native Hawaiian or Pacific Islander, 9.2% two or more races
Free and reduced-price lunch participation: 55.8% free, 10.4% reduced
Gifted: 9.8%
Statewide test scores (percentage who meet or exceed standards): 37 language arts, 37 math
Pound

Pound Middle School, 4740 S. 45th St.
Enrollment: 700 students
67.6% white, 0.6% American Indian or Alaska Native, 4.6% Black or African American, 2.4% Asian, 12.4% Hispanic/Latino, 0.1% Native Hawaiian or Pacific Islander, 12.3% two or more races
Free and reduced-price lunch participation: 25.7% free, 8.6% reduced
Gifted: 22.4%
Statewide test scores (percentage who meet or exceed standards): 59 language arts, 60 math
Schoo

Schoo Middle School, 700 Penrose Drive
Enrollment: 898 students
63.9% white, 0.4% American Indian or Alaska Native, 7.2% Black or African American, 5.0% Asian, 12.1% Hispanic/Latino, 0.1% Native Hawaiian or Pacific Islander, 11.1% two or more races
Free and reduced-price lunch participation: 30.3% free, 9.7% reduced
Gifted: 15.5%
Statewide test scores (percentage who meet or exceed standards): 50 language arts, 48 math
Scott

Scott Middle School, 2200 Pine Lake Road
Enrollment: 1,182 students
77.7% white, 0.2% American Indian or Alaska Native, 3.2% Black or African American, 4.6% Asian, 7.2% Hispanic/Latino, 7.1% two or more races
Free and reduced-price lunch participation: 13.1% free, 4.3% reduced
Gifted: 30.1%
Statewide test scores (percentage who meet or exceed standards): 65 language arts, 70 math
East
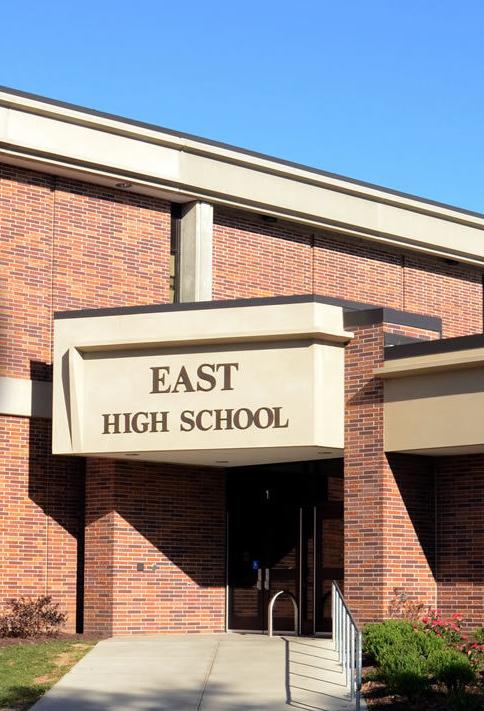
East High School, 1000 S. 70th St.
Enrollment: 2,250 students
78.7% white, 0.2% American Indian or Alaska Native, 2.2% Black or African American, 4.6% Asian, 8.4% Hispanic/Latino, 5.8% two or more races
Free and reduced-price lunch participation: 14.6% free, 5.3% reduced
Gifted: 24.4%
Statewide test scores (percentage who meet or exceed standards): 59 language arts, 58 math, 63 science
Lincoln High

Lincoln High School, 2229 J St.
Enrollment: 2,320 students
42.6% white, 1.7% American Indian or Alaska Native, 11.9% Black or African American, 8.9% Asian, 23.3% Hispanic/Latino, 0.1% Native Hawaiian or Pacific Islander, 11.5% two or more races
Free and reduced-price lunch participation: 47.5% free, 9.7% reduced
Gifted: 15.5%
Statewide test scores (percentage who meet or exceed standards): 36 language arts, 34 math, 34 science
North Star
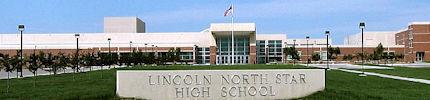
North Star High School, 5801 N. 33rd St.
Enrollment: 2,243 students
54.9% white, 0.4% American Indian or Alaska Native, 8.7% Black or African American, 6.5% Asian, 21.5% Hispanic/Latino, 7.9% two or more races
Free and reduced-price lunch participation: 42.1% free, 9.7% reduced
Gifted: 10.1%
Statewide test scores (percentage who meet or exceed standards): 29 language arts, 31 math, 34 science
Northeast
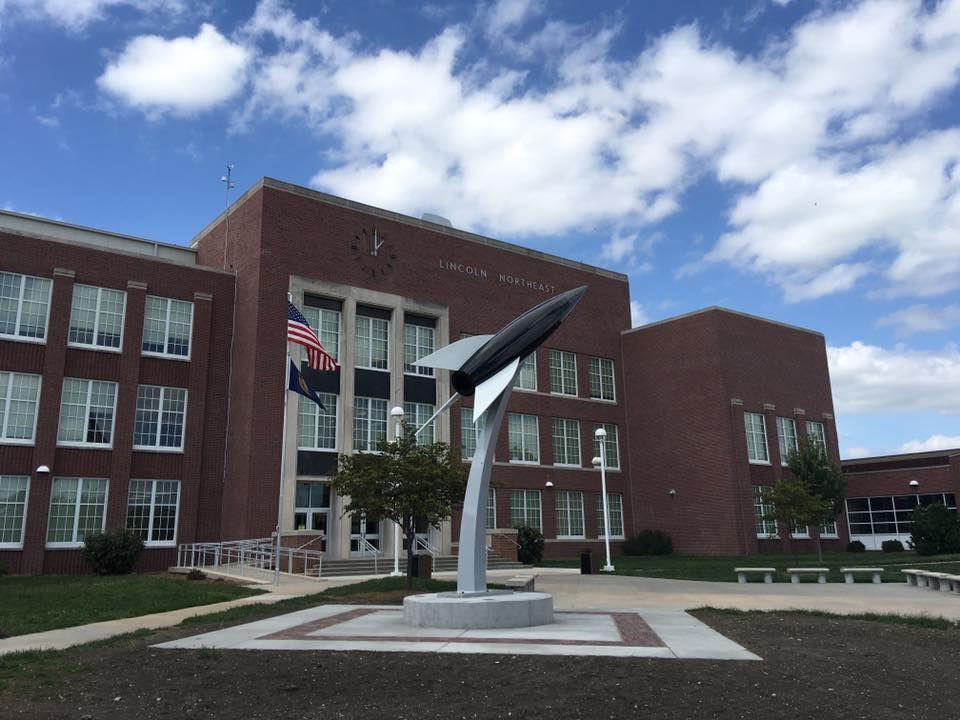
Northeast High School, 2635 N. 63rd St.
Enrollment: 1,869 students
59.4% white, 1.3% American Indian or Alaska Native, 9.7% Black or African American, 2.4% Asian, 17.1% Hispanic/Latino, 0.2% Native Hawaiian or Pacific Islander, 10.0% two or more races
Free and reduced-price lunch participation: 49.9% free, 10.8% reduced
Gifted: 10.6%
Statewide test scores (percentage who meet or exceed standards): 32 language arts, 30 math, 34 science
Southeast
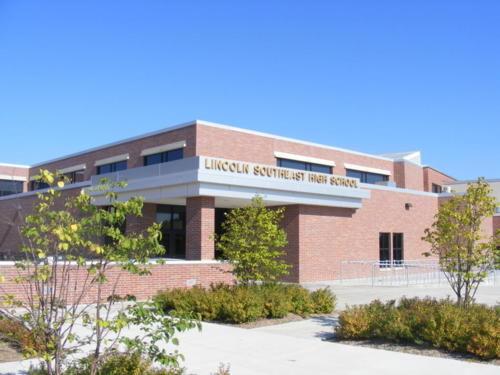
Southeast High School, 2930 S. 37th St.
Enrollment: 1,980 students
73.4% white, 1.1% American Indian or Alaska Native, 3.8% Black or African American, 1.2% Asian, 10.6% Hispanic/Latino, 0.3% Native Hawaiian or Pacific Islander, 9.6% two or more races
Free and reduced-price lunch participation: 25.1% free, 7.6% reduced
Gifted: 22.6%
Statewide test scores (percentage who meet or exceed standards): 49 language arts, 48 math, 53 science
Southwest
Southwest High School, 7001 S. 14th St.
Enrollment: 2,196 students
76.8% white, 0.2% American Indian or Alaska Native, 3.9% Black or African American, 3.8% Asian, 9.6% Hispanic/Latino, 5.7% two or more races
Free and reduced-price lunch participation: 17.7% free, 5.1% reduced
Gifted: 24.4%
Statewide test scores (percentage who meet or exceed standards): 62 language arts, 58 math, 64 science
Reach the writer at 402-473-7226 or mreist@journalstar.com.
On Twitter @LJSreist

Margaret Reist
Local government reporter